
Being Patient At The Plate Doesn't Correlate With Scoring More Runs

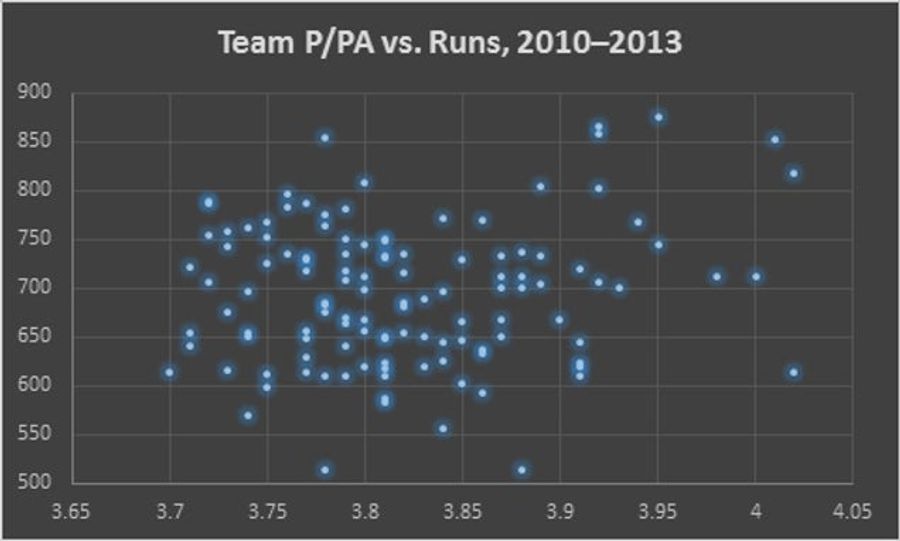
If you want a good baseball offense, you need to milk to pitch count. That's what it says in Moneyball, and it's been Red Sox gospel under Terry Francona. But as the graph above from shows, it isn't significantly related to offensive production.
From 2010 to 2013 teams who see more pitches per plate appearance have had both low offensive production (Red Sox, Mets, Phillies) and high production (Blue Jays, Athletics, Indians). Whether looking at runs scored or team offense (wRC+), correlations with plate patience were negligible.
This doesn't seem to be just some effect of the league catching up with the trend, either. We went back a bit further and looked at pitches per plate appearances in 1999. In 1999 batters saw a similar amount of pitches per plate appearance as they did in 2010 (3.73 in 1999, 3.82 in 2010). And like post-2010 trends, there was no significant correlation (0.19) in 1999 between pitches per plate appearance and runs scored.
The only significant relationship found in the article is that patient teams were more likely to garner another at bat when a starting pitcher is going through the lineup for the fourth time. But this resulting added at bat generally happens at the bottom of the lineup, which reduces its impact.


NBA Predictions Today: Expert Picks for March 24th Games

Why Ty Simpson Could Quickly Rise Up NFL Draft Boards

Two Best Longshot Bets to Win the 2026 World Series


2026 NFL Mock Draft: First 12 Picks Predictions and Analysis


- March Madness Sunday Bets: Texas Tech, Tennessee
- UFC London Betting Picks: Best Plays for Fight Night
- Best March Madness Saturday Picks: Arkansas vs. High Point, Vanderbilt ML
- Akron vs Texas Tech, Clemson vs Iowa: Best Bets for Friday
- NCAA Tournament Thursday Picks: Why Georgia and Saint Mary’s Offer Value
- NBA Picks Today: Best Bets for Warriors vs Celtics, Lakers vs Rockets
- Miami (OH) vs SMU Prediction: Best Bet for NCAA Play-In Game
