
Cash Rules? Breaking Down The Budget Mismatches In The NCAA Tournament

Inequality of college athletic spending is something we all know exists. But strangely, it's not a common topic of conversation in the lead-up to today's hysteria of March Madness and its bracketful of would-be giant-killers. So let's take a look at who's bringing a knife to an Aston Martin fight.
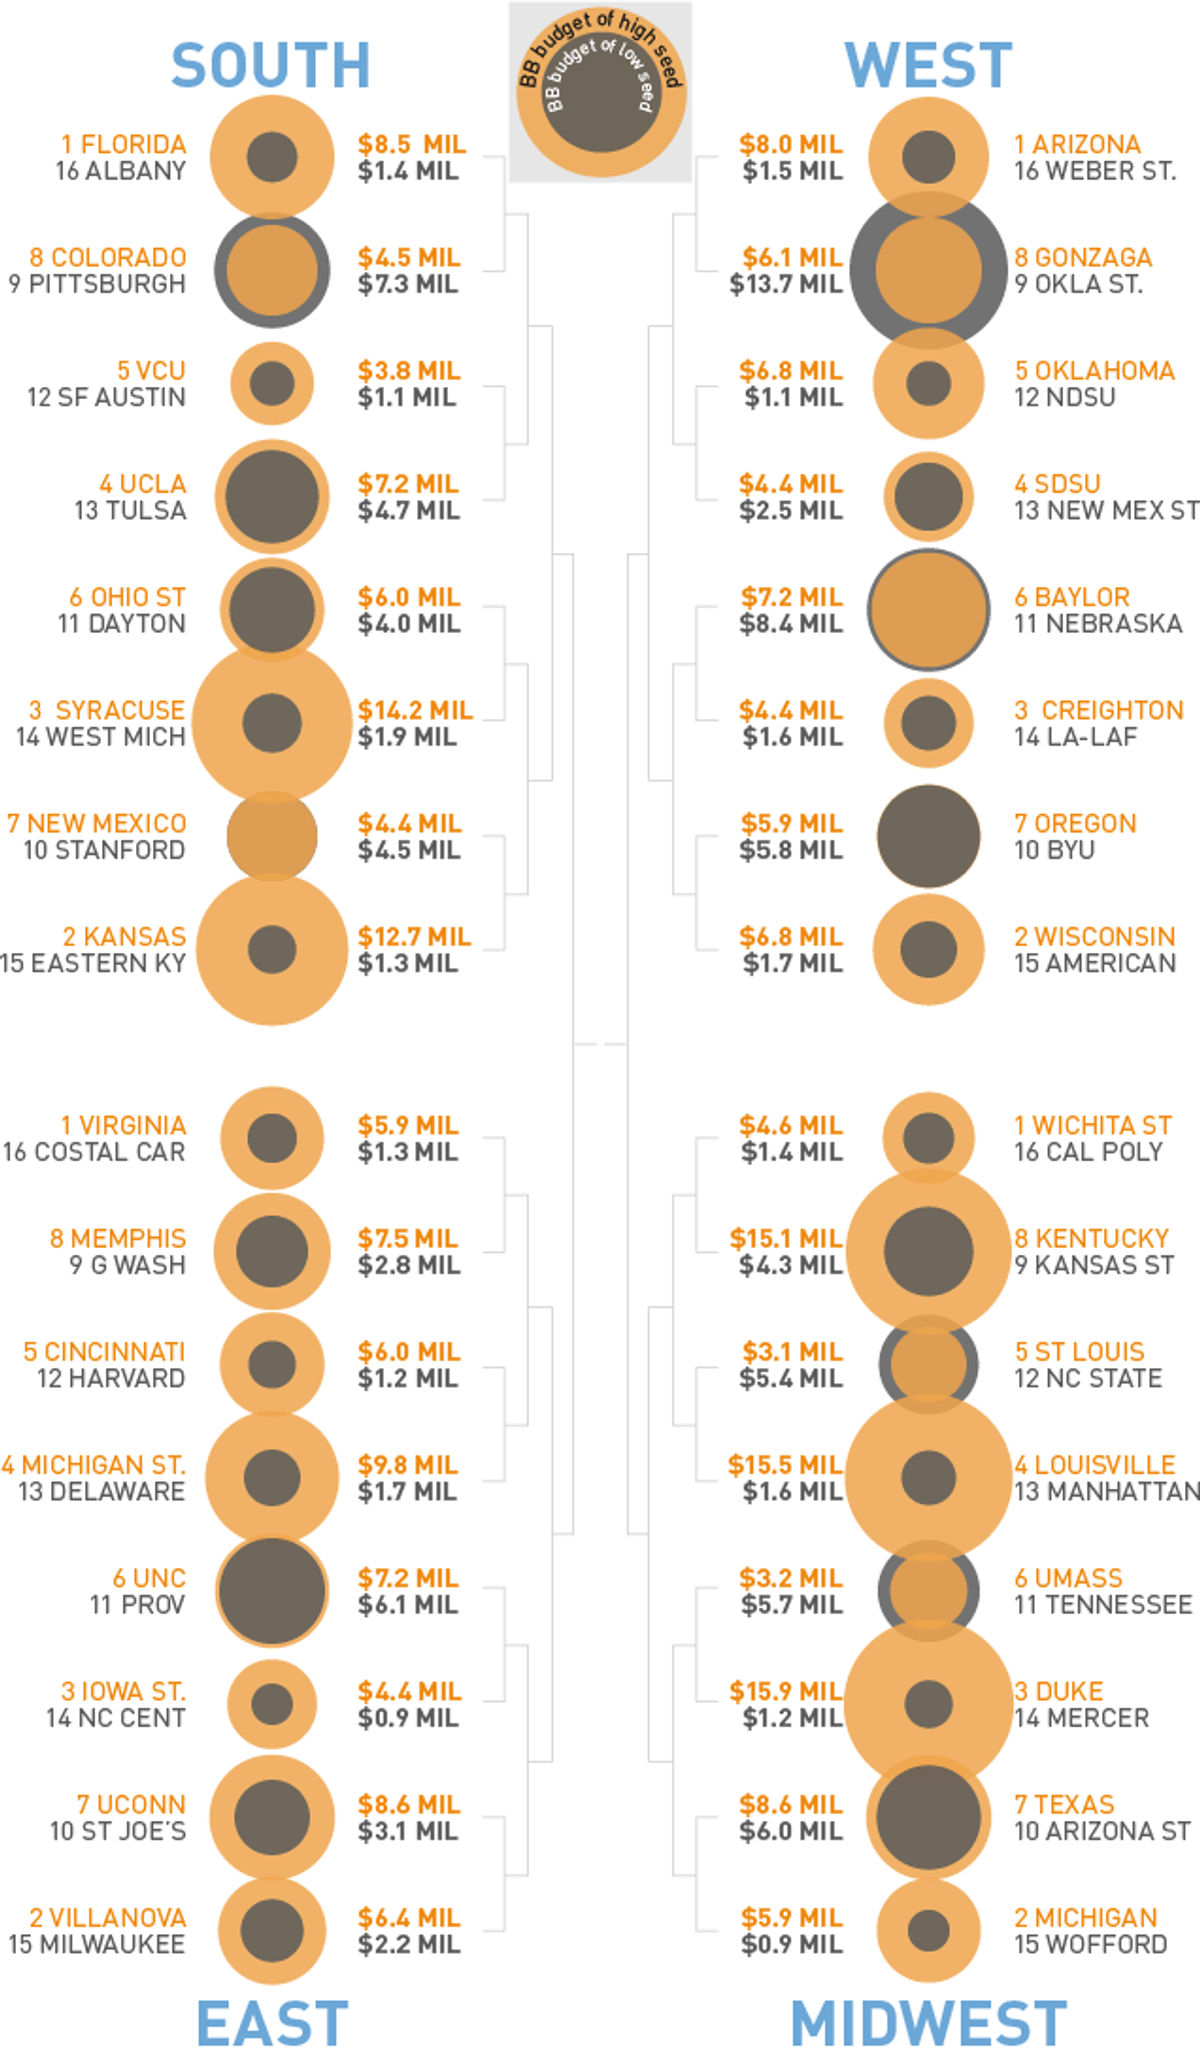
We've broken down all 64 remaining teams' college basketball budgets from the 2013 season, using data from the Office of Postsecondary Education via the terrific website BBState. Why does the amount of money spent on basketball matter? Because that money goes directly toward schools' recruiting costs and coaching salaries, the two major variables in predicting a basketball team's overall strength. You can judge upsets based on where the NCAA selection committee seeded teams, but when a school manages to beat an opponent that spends significantly more money on basketball, that's the very definition of doing more with less.
In the above graph, circle sizes represent how much each school spends on basketball. The orange circle represents the higher seed, or "favorite," while the grey circle represents expenditures by the "underdog." The greater the discrepancy between circle sizes, the bigger the inequality between schools.
As you can see, not every favorite is working with a money advantage. There are six "underdogs" who outspend their opponents in the round of 64:
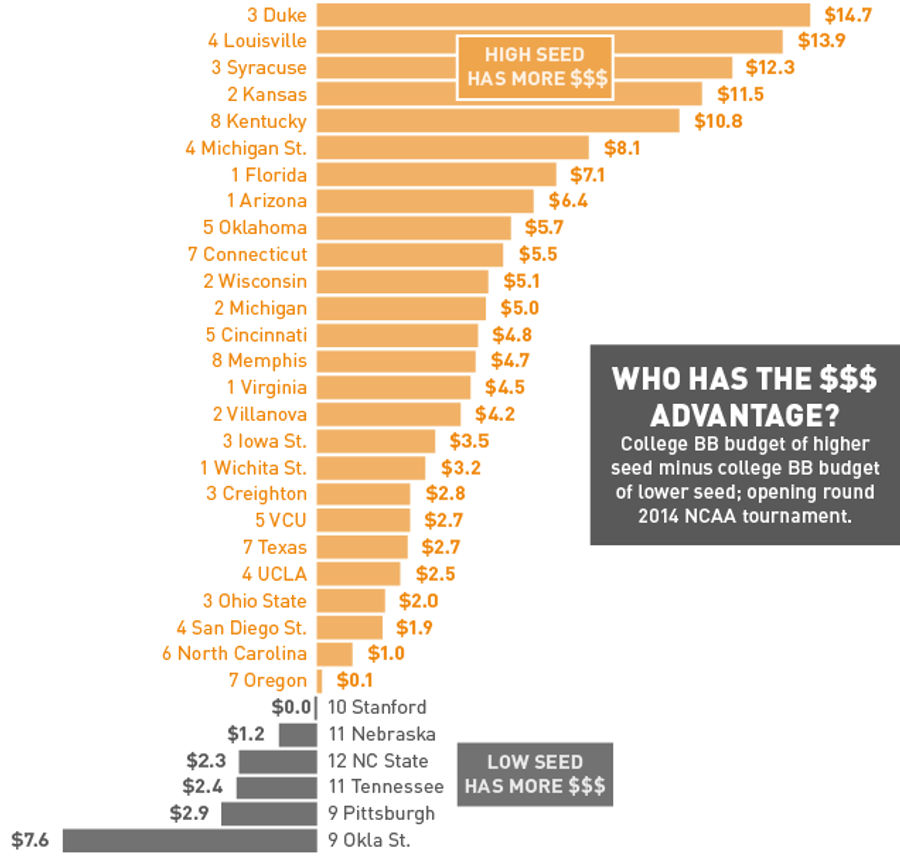
That Duke has the biggest money advantage in the bracket thanks to playing miserly Mercer shouldn't surprise you. Oklahoma State's advantage, might—though only for the second it takes to remember T. Boone Pickens is a very wealthy man.
Graphs by Reuben Fischer-Baum. Photo illustration utilizes photo by Gerry Broome/AP.
Related


Cavaliers Emerging as Heavy Favorites for LeBron James

MLB Best Bets Today: Top Picks for Monday, July 6
- MLB Best Bets for Monday: Giants Value and Rangers-Angels Under
- MLB Best Bets Today: Top Picks for Monday, July 6
- MLB Picks Today: Best Bets for Padres vs. Dodgers, Marlins vs. Athletics, Blue Jays vs. Mariners
- Fourth of July Best MLB Betting Picks and Predictions
- MLB Best Bets: Friday Picks for Cardinals-Cubs and Red Sox-Angels
- WNBA Picks Today: Best Bets for Sky vs. Aces and Lynx vs. Liberty
- MLB Best Bets Today: Reds vs Brewers, White Sox vs Guardians, Rangers vs Tigers Picks
