
What if there was a Mendoza Line for other baseball stats?

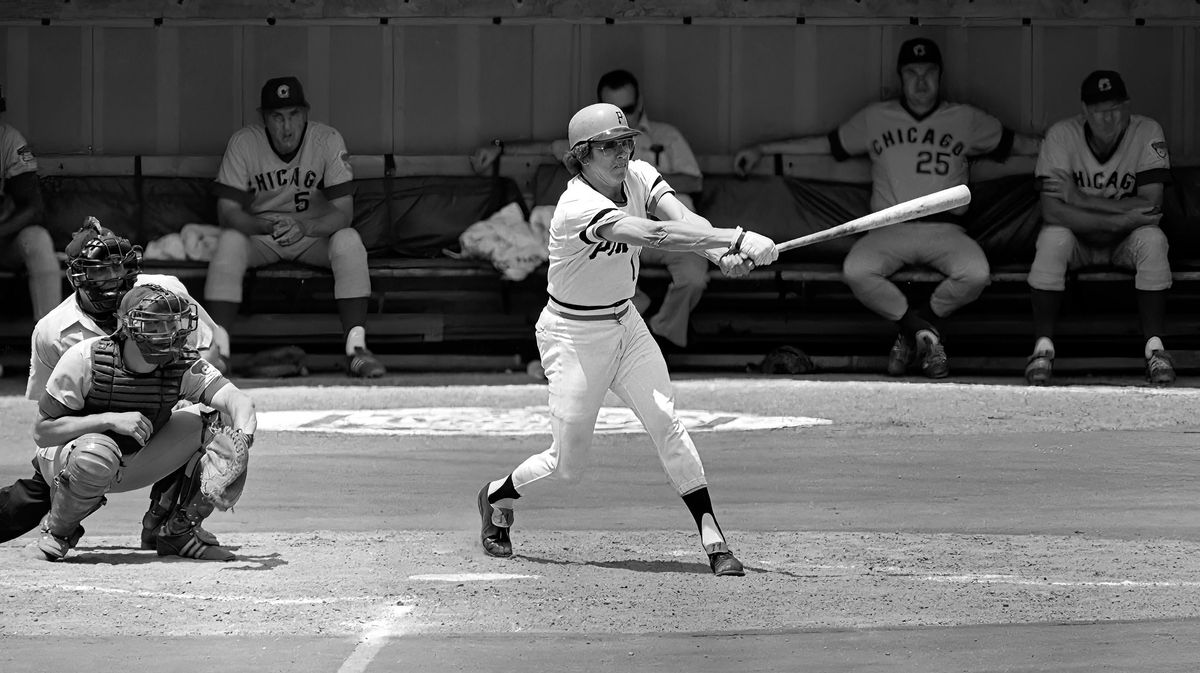 Mario Mendoza was a career .215 hitter in 9 big league seasons credits: George Gojkovich | source: Getty Images
 Mario Mendoza put together nine nondescript major league seasons from 1974-1982 with the Pittsburgh Pirates, Seattle Mariners, and Texas Rangers. He was good for -2.7 WAR and finished with a career .215 batting average.
The 5-foot-11, 170-pound shortstop barely hit above his weight, and has become famous (infamous?) for offensive futility. An article on credits George Brett with inventing the term, saying — during a 1980 slump — “The first thing I look for in the Sunday papers is who is below the Mendoza line.”
However, Mendoza said the term was coined in 1979 by his then-Seattle teammates Tom Paciorek and Bruce Bochte to make fun of him, then Brett the following season. ( Mendoza batted .198 in 1979).
However, baseball has evolved. With all the advanced metrics, batting average has become something of an antiquated stat for judging how good a hitter is.
That’s why we need a new Mendoza Line. Hell, even several of them. It’s time to find the player who most exemplified Mendoza’s commitment to being pretty bad, but for each category. It’s time to determine where the lines are for OPS, home runs, and ERA are, and which players they should be named after.
Methodology
Time to lay out some ground rules. If these names are going to stick around in the baseball zeitgeist like Mendoza’s has, then there need to be standards for how I go about selecting them.
First, the player should have roughly the same relationship to their respective “line” that Mendoza had. Mendoza was a career .215 hitter, but that’s a bit misleading. In more seasons than not, he actually hit below .200. His career average was brought up by what I would describe as two outlier seasons: 1974 when he hit .221 in 91 games (the third most he played in a season), and 1980 when he hit .245 in 114 games (the second most he played in a season).
The ideal player for each “line” should camp out just below it, only crossing the threshold every so often.
Second, it should be applicable today. Although it’s been more than 40 years since Mendoza played his last Major League game, the .200 mark is still a pretty good bare minimum for a hitter. Today, if you see someone hitting below .200, you probably think, “Wow this guy sucks, and is also named Joey Gallo.”
The “line” for ERA isn’t going to be from the dead ball era because a worse-than-average ERA back then would probably be a Cy Young winner in 2023.
Now, here’s how I calculated just how bad the Mendoza line is, and therefore the “lines” for other stats. The league batting average during Mendoza’s career was about .260 (not much different from today) but I couldn’t just say that .200 is 77 percent of .260 so let’s look for stats that are 77 percent of the average, because that’s not how statistics work.
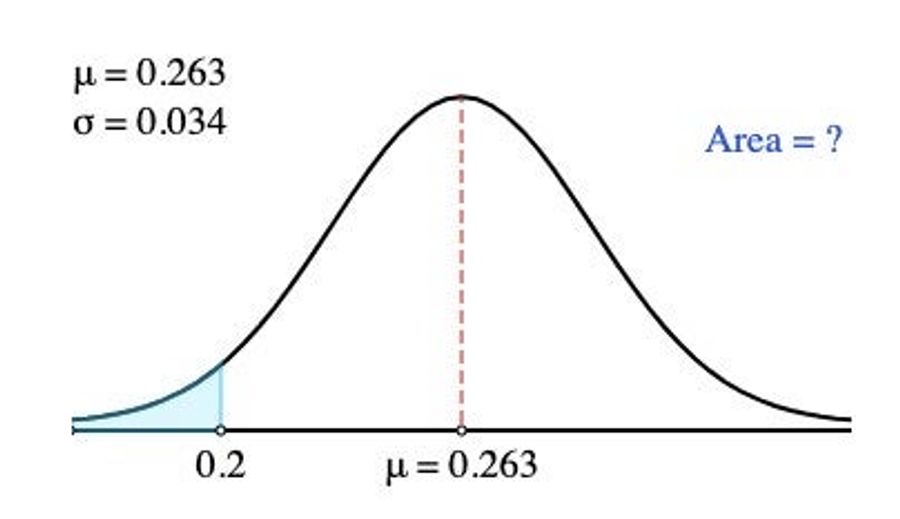
Most players are going to be around the average with fewer and fewer players the farther you go to either end, forming a bell curve. I needed to find where the Mendoza line was on the batting average bell curve.
I chose the 1979 season because that was when Mendoza was his most Mendoza-y. He hit .198 while playing in the most games in any year of his career. I copied the batting averages of all 354 players with at least 100 at-bats into a spreadsheet and found their collective average was 0.263.
I then copied these values into a standard deviation calculator to get 0.034, meaning that I had all the ingredients for a normal distribution graph. I (the website I was using) was then able to calculate that the area to the left of the Mendoza line is P(X < 0.2) = 0.0322. My seven-year-old Mac was boiling hot, but I was even hotter on the trail.
Following? Me neither. I learned this on the fly with the help of some faint memories of that one statistics class I took in college. Are you a math person who not only understands this stuff but has a problem with my methodology? Well please be nice, because I majored in journalism. It’s a miracle I made it this far.
Knowing that P(X < 0.2) = 0.0322, the next step is to find this point on the bell curves for other stats to find their respective “lines.” Then it’s just a matter of finding the player who is consistently near it.
OPS
Keeping in mind that these stats should be applicable today and into the future, I used 2022 stats, the most recent full season. The 458 hitters who had at least 100 at-bats had an average OPS of .689. The standard deviation is .105. The “line” for OPS is 0.495 because it worked out exactly that P(X < 0.2) = 0.0322.
This is the really challenging part. Anyone with an OPS that bad isn’t going to stick around in MLB for long (another thing that makes Mario Mendoza’s nine-year career all the more impressive). So don’t expect any household names. That being said, I think there’s a great candidate.
Christian Pache is in his fourth season in the MLB and has been below this threshold in two of them, reaching .500 in another. His candidacy is kind of undercut by the fact that he’s having a great season at the plate this year for the Philadelphia Phillies, but his .957 OPS this year only brings his career OPS up to .510.
The Pache Line: 0.495 OPS
Earned Run Average
The 410 pitchers who threw at least 40 innings in 2022 combined for a 3.82 ERA. The standard deviation is 1.19. The “line” is 6.02.
Anthony Banda has been in the MLB since 2017, primarily coming out of the bullpen. His career ERA is 5.69. This year, it’s 6.43, and last year it was 6.75 while appearing for four teams. In his rookie year, it was almost exactly on the line at 5.96.
The Banda Line: 6.02 ERA
Home Runs
It’s at this point where I found a flaw with my method. It may not be the best for counting stats. Using players who had at least 100 at-bats made the “line” effectively 0, which is no fun. So I upped the cutoff to 300 at-bats, and it was still 0. Then 400 was also 0.
It only works for counting stats if you calculate it based on players who have played a lot. So by only using the 92 players the at least 500 at-bats, we get an average of 21.75 home runs, a standard deviation of 10 when rounded to the nearest hundredth, and a “line” of 3.3. Of course, you can’t hit 0.3 home runs so let’s call it an even three.
A really low bar to clear of course. I’m tempted to also call this the Mendoza Line since he only hit four in his career. Luckily, there’s a more recent example of an everyday player who would look at this line and see Mt. Everest.
Dee Strange-Gordon played in more than 1,000 games over 11 MLB seasons and tallied just 18 home runs. A great contact hitter, he was able to make two All-Star teams despite having three or more home runs in just three seasons. He was at one point suspended for 80 games for PED use even though they clearly didn’t give him extra pop.
The Strange-Gordon Line: 3 Home Runs
RBI
Keeping the standard of players with at least 500 at-bats, we get an average of 77.03 RBI, a standard deviation of 19.69, and a “line” of 40.6, rounded evenly to 41.
J.D. Davis has 202 career RBI in seven MLB seasons. Not counting the shortened COVID season or his first two when he barely played, he averaged 42.5 in the other four.
The Davis Line: 41 RBI
Strikeouts (Batting)
Again sticking with batters with at least 500 at-bats, the average is 123.75. The standard deviation is 32.26. The “line” is 183.5 strikeouts, rounded to 184.
Eugenio Suárez has led the league in strikeouts in two of the past four complete seasons, and is currently in the lead this year.
The Suárez Line: 184 Strikeouts
Strikeouts (Pitching)
For a realistic number, it’s necessary to be more selective with the data set for counting stats, just like with the hitters. Rather than pitchers with at least 40 innings, I’ve upped it to the 99 pitchers who pitched at least 125.
Their average strikeouts was 152.08. The standard deviation is 32.26. The “line” is 92.3 strikeouts, rounded to 92.
Because this line was calculated from pitchers who pitch a lot of innings, it’s only fair that it’s named after a starter. Ross Stripling mostly qualifies. He’s started and come out of the bullpen in every season of his career, but has started more games than not. Not counting 2020, his strikeouts per year are nearly identical to the “line.”
The Stripling Line: 92 Strikeouts
Walks (Pitching)
The average walks among pitchers with at least 125 innings was 45.84. The standard deviation is 12.39. The “line” is 68.7, rounded to 69 (let’s all be adults about this).
I had to go look at a previous era to find this one. By today’s standards, 69 walks is an insane amount. There were only three pitchers who hit that mark last year, and it’s far from a yearly occurrence for each of them.
Going all the way back to the 40s and 50s when there were way more walks, there are dozens of pitchers that could be this “line’s” namesake. I went with Johnny Sain, a three-time All-Star who also led the league in saves when he moved to the bullpen near the end of his career.
He averaged over 66 walks in seasons where he pitched at least 100 innings. He also missed three MLB seasons for military service in World War II. Judging from his Wikipedia page, the Navy pilot never saw combat, which was probably for the best. I doubt he could hit a Japanese aircraft carrier from a plane if he couldn’t even hit the strike zone from 60 and six inches.
The Sain Line: 69 Walks
Hit Batters
The average 6.4 hit batters. The standard deviation is 3.77. The “line” is 13.37, rounded to 13.
Charlie Morton has led the league in hit batters four times and has hit 13 or more in seven different seasons. (Editor’s note: TIL there was a Charlie Morton who played three seasons in the 1880s as an OF/3B/2B.)
The Morton Line: 13 Hit Batters
In conclusion
If there are any stats I missed that you wanted to see, well you can find those “lines” yourself and find a player that most closely fits them. The formula is there. In the meantime, let’s do our best to get these examples into the vernacular. This time next year, I want to be in a bar and hear someone I’ve never met who’s watching a baseball game say something like “This guy is going to be on the wrong side of The Suárez Line this season.”
Related
What Prediction Markets Are Telling Us About NFL 2026 MVP
The Sacramento Kings Need to Blow It Up Before It's Too Late


Ben Askren Didn't Win the Match—But He Won the Weekend
- UFC Fight Night Best Betting Picks for Du Plessis vs. Usman in OKC
- France vs. England Best Bets: Three Picks for the World Cup Third-Place Match
- Dodgers vs. Yankees Friday July 17 Best Betting Picks and Props
- July 17 White Sox vs. Blue Jays Prediction, Odds and Best Bets
- Three MLB Futures Bets to Make After the All-Star Break
- Three Heisman Trophy Sleepers Worth Betting Before the 2026 Season
- England vs. Argentina Best Bets: Three Picks for the World Cup Semifinal
