
The Prettiest MLB Box Scores You Can Find Online Are Now Updated Live

You might remember Statlas's baseball graphics from the end of last season, which aimed to provide a more contextual, visually-appealing update to traditional MLB box scores.
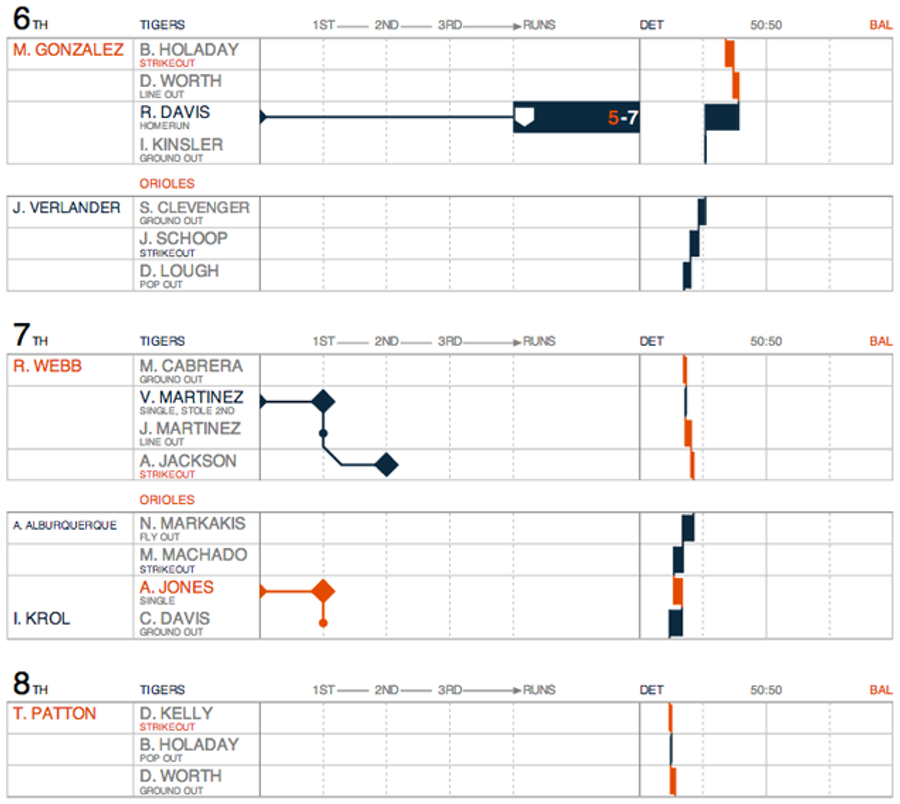
Statlas has revamped their design for the 2014, and introduced one key change: Their graphics now update in-game. The image above is a small portion of the chart from this afternoon's Tigers-Orioles matchup, which just entered the bottom of the eighth. Here's a sampling of the pitching data:
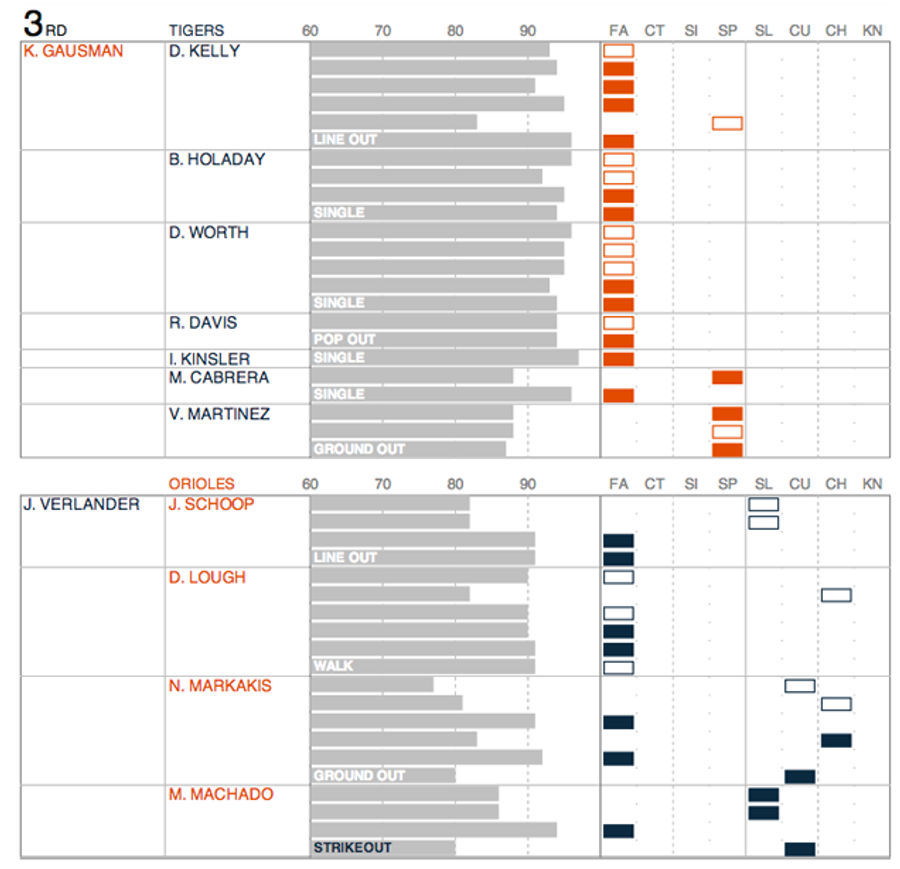
There's almost too much information here—the outcome (and effect on win expectancy) of every plate appearance, plus the type, velocity, and outcome of every pitch—but it's neatly presented and a load of fun to dig through. Go check some of them out.
[ Statlas]
Latest


Why the Tar Heels Made a $50M Gamble on Michael Malone
Fri Apr 10 2026


Why None of These NBA Play-In Teams Are True Contenders
Thu Apr 09 2026


Latest Betting
- Wednesday April 8th MLB Pitcher Props: Dylan Cease and Kyle Bradish Bet Picks
- MLB Picks Today: Best Bets for Diamondbacks vs Mets and Athletics vs Yankees
- Masters Betting Picks 2026: Best Value Bets Beyond Scottie Scheffler
- Best NBA Betting Picks and Predictions for Monday April 6th
- National Championship Bet Pick: Why Michigan Has the Edge Over UConn
- UFC Vegas 115 Betting Picks: Moicano vs. Duncan Headlines April 4th Card
- NBA Betting Picks April 4th: Three Best Bets for Saturday's Slate
