
Why Soccer's Most Popular Advanced Stat Kind Of Sucks


Here's some free advanced soccer analytics: .095.
Count the number of shots a player or team takes, multiply it by .095. Congratulations, you've just been spared the scores of hours it takes to build an Expected Goals model. Crude, yes. But, ultimately, it's probably not much worse than what's out there because Expected Goals is kind of garbage.
What are Expected Goals?
Expected Goals (ExpG), is just that; it's a measure of how many goals a team should have scored based on where a shot was taken and (sometimes) a few other factors: if it came from a corner, if it was headed, or if it was taken against an opponent reduced to 10 men, etc. If you've ever done an expected value calculation for an intro finance class, it's the same thing—the probability a shot goes in multiplied by its value (and all goals in soccer are worth 1). Add them all up, voila: expected goals.
For example, on Monday Crystal Palace beat Man City 2-1 to pretty much end the latter's title defense. But, given the observed, spatial quality and sheer quantity of their shots, City "should have" won—and easily. (The blown handball call in the box didn't help, mind.) Palace "should have" scored 1.11 goals and City "should have" scored 1.64 goals. When you consider that a huge chunk of Palace's value came from a shot off a probably-botched offside call, with competent officiating (in the Prem? Ha!), they really only had an ExpG of about 0.4.
The point is, the stat starting to gain traction, to the point that it might undergo a WAR-like transmogrification from computational curiosity to contract negotiation item. In the recent weeks it was used in ESPN pieces here and here, the latter of which was thematically similar to a piece done here by Statsbomb in December. It even turned up in one of the final papers at this year's Sloan Sports Analytics conference.
As a stat, ExpG has a lot going for it: The basic intuition behind it—that some shots are more likely to go in than others—is super easy to understand. Making sense of the metric is also not very hard. If your actual goals—what a player or team scored—is greater than expected goals, then you are over-performing, or efficient, or something. Pretty much anybody can understand "ratio > 1 is good". Finally, the units are goals. Even the biggest numerophobe would have a hard time poo-pooing something that tries to measure the one stat that matters in soccer (namely: how many did you score?).
Okay, why does it suck?
But again, the models that are trying to calculate ExpG—one here, here (with a little more information here), here, and here, and several more at the tip of a Google search—are likely terrible. And they can be terrible for different reasons.
First, some are just, to be polite, sub-optimally constructed. Those two ESPN posts, they rely on the model spelled out in that last link above. The guy who made it, Michael Caley, walks through his process on that page (click on the " Methodology" button at the bottom of the post to toggle the section). But basically, he takes a bunch of shots, groups them by a range of distances (0-6 yards, 6-9 yards, 9-12 yards, etc.), then averages how many went in for each of the ranges. It ends up being 12 discrete intervals, and they describe a nice, smooth curve. He took that info to an online tool and had it return a formula that describes the resulting curve. (I think that's what he did, at least; when I contacted him to clarify, he answered my questions by sending a link to the very SB Nation post I was asking about.)
That doesn't sound totally unreasonable. Now if you measure how far from goal a shot was, you can match it to a probability that it went in (on average). You've got a ton of data behind it, so it must be pretty accurate, right?
Actually, no. You've thrown all your data away. You might think those thousands of shots are contained in those 12 data points, but ultimately when you go to zunzun.com (which no longer has an active page at that URL) or whatever and say, "Fit an equation to these numbers," it only goes to work on those 12 data points. Caley hints at the problem when he calls the resulting .997 r-squared "comically high", he just misses the hint.
Misuse of r-squared
For those less statsy, one way to think about r-squared is as a measure of how good your model is. Generally, closer to 1 is "good" and close to zero is "bad." "Generally" because sometimes being really close to one can be an indication that something went wrong. An r-squared of 1 means that you are perfectly predicting something. So that "comically high" .997 number should raise a lot of red flags with Caley's model.
First, an r-squared that high should be suspicious in itself. Complex systems will almost never have such a great fit with just one variable doing the prediction. Near perfect? In soccer? With 12 data points? No.
Second, r-squared is basically meaningless for non-linear models. The way it's calculated doesn't work for curved things. If you do it anyway, you consistently get really high values for both good and bad models. In fact some stats applications don't even give an r-squared in the output when doing non-linear fits, probably because it's useless.
Finally, and most importantly, if it really were the case that just the distance by itself almost perfectly predicts (.997) the probability that a shot goes in, then you have reached the Singularity. You don't need to bother with any of the subsequent conditions (was it from a cross, what's the speed of the attack, etc.). Your work is done. Close up the laptop, ask for a raise, order drinks.
This is not to pick on Caley. He just happened to show his work. This guy here did pretty much the same thing (and surprise, in a non-linear model he also got a suspiciously high r-squared). And through 40-plus comments on the SB Nation post where Caley goes over the methodology nobody else picks up on the inherit flaws. Is it a model? Sure. Is it any good? Well, the intuition behind it isn't terrible. But if you have a few thousand data points, you should use probably use them. In fact, you should definitely use them! By not using them, you deprive yourself of knowing whether the model is any good. And you can still model all of this using regression, and still get a meaningful r-squared.
Another problem is the results just stink
The model using the data points is done via logistic regression (i.e. things that have binary outcomes): True or false? Did the drug cure the patient? Goal or no goal? When you do a logistic regression here, you find the (other) big problem with ExpG and the one that nobody seems to mention: The results are not at all good. At least mine weren't. And I did it a few different ways.
I started with the shots from two seasons' worth of games in England, Germany, and Spain (sorry Serie A, nothing personal) and made a very basic model using just two variables: the distance from the shot to the center of the goal (technically the log of the distance), and the visible angle of goal (the one formed from each of the goalposts to the shooter). After removing penalties and own-goals, it's about 50,000 shots.
Running that regression gives you an r-squared of .121. That's solidly in the poor end of the scale*. From a prediction standpoint, it's nothing to get super jazzed about. The coefficients themselves are really significant. In other words, the probability you make a shot absolutely does decrease as you move away from the goal—no shit, right, but at least the math agrees with what seems obvious—it's just there is a ton of deviance that we're not explaining any better than just drawing straight line through an average number of goals scored.
Clearly, though, there is a ton of stuff that goes into a scoring chance beyond those two factors. So I dumped everything in: the league, the game state (who was winning and by how much), whether the home team or the away team took the shot, was the shot taken in the first half or the second half, was the shot headed. I even put what the month the game was played into the model.
It ends up being about 15 different variables and almost 80 total factors. The latter number is large because some of the variables have multiple values. In other words, 10 of the 80 are just the months (one for each August, September, etc. [10 because there are no league games in June and July]). So 'month' is one variable, but 10 of the factors. And with all of this additional information we get a way better model for prediction and the r-squared skyrockets, right?
Wrong. It goes to about .165. Still low**.
It's hard to say with any confidence if any of the other models are better or worse because they don't tell us much. Statsbomb is one of the more popular sites for soccer analytics. And they generally do interesting work. But they don't give much transparency into the quality of their ExpG model. In fact in the post where they debut the model, they explicitly state: "The exact calculations of ExpG will remain private as a lot of work between us has been dedicated to its creation."
And that's totally reasonable. Doing stats can be enormously time-consuming (I spent about a month of spare time building my ExpG models). People are under no obligation to just give that work away. Moreover, if you think you've got a really good model, there is economic value in keeping it private. Sorry folks, but rent wants to be paid more than information wants to be free.
So are any of these actually good?
The question now is if we have all the information. Statsbomb might have some additional factors that give them a higher r-squared. Full disclosure: there are two variables that I couldn't pull out of the data that I'm pretty sure would help give more predictive power. How much? I don't know, but maybe Statsbomb figured out how to accurately get at those (or a proxy for them). It's possible that they have done a significantly better job. But I doubt it.
Statsbomb plots a graph here that, with some mimicry, we can maybe back door a check against the quality of their model:
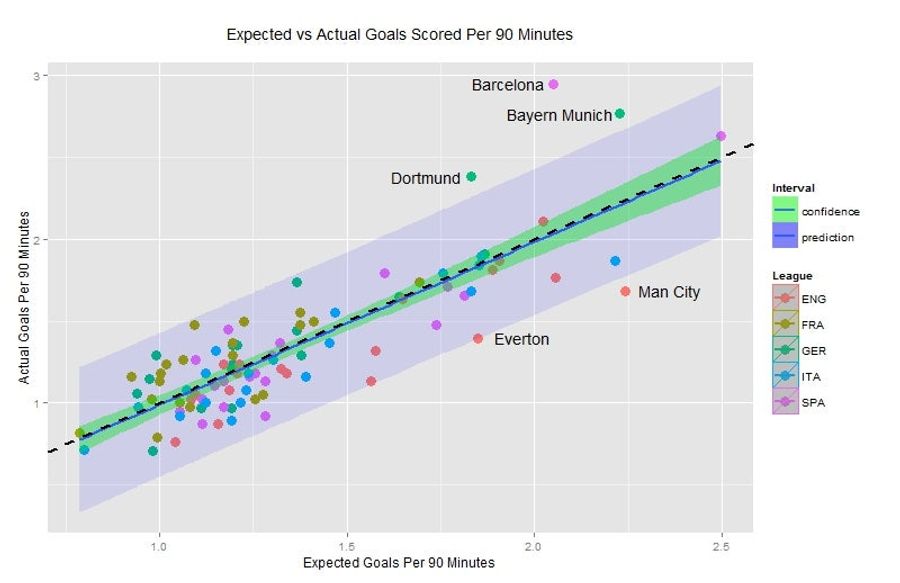
That's a plot of their ExpG calculation versus a team's actual goals. The idea being that, if the model is any good, the former values should line up pretty well with the latter values. And if they checked it against in-sample data (the same data they built their model with), it should absolutely be a good fit.
So I took the dumbest model I could think of and plotted the exact the same thing. The super dumb model? It's the .095 freebie from the top of this piece***. In other words, nothing—not distance, not angle, not that it was Zat Knight and not Bas Dost who took that shot, not even that it it was taken on a wet Tuesday night at Stoke—does anything to help explain whether a shot has a better (or worse) chance of going in. They go in at a rate of just under 1 in 10. Period.
Anyway, I 'predicted' ExpG using the .095 dumb model and graphed it against the actual goals scored. The result?
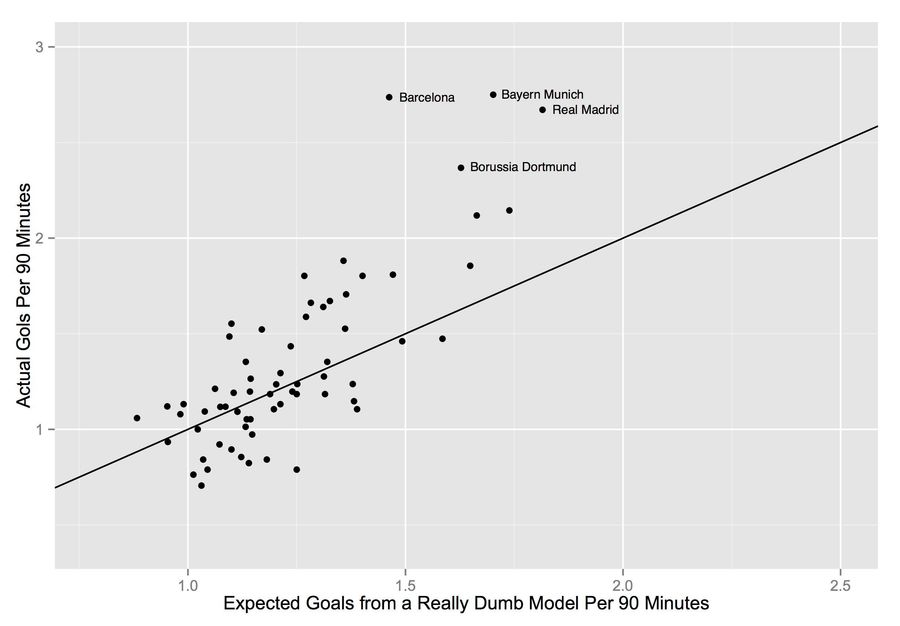
I got the x and y scales pretty close to Statsbomb's plot, so that it should look similar enough to make visual comparisons. Mine lacks the pretty colors because I suck with ggplot (the graphing package that Statsbomb used). It's also missing the shaded ranges because I'm not entirely certain which confidence interval they were graphing (not a knock, just not sure, so I left it out).
Anyway, the Stasbomb graph doesn't appear to be significantly better, or different. This comes with the huge caveat that our datasets are not identical. They've got one season of five leagues (England, Germany, Spain, Italy, France), I'm using two seasons of three leagues (England, Germany, Spain). Also, I'm not sure if they left penalties in their data (I removed them). A free shot at the keeper from 12-yards out might cause non-trivial differences.
Just visually though there are, what, only six or seven (out of 66) teams that I totally whiffed on. And mostly those are the really good teams. There's probably just no way to accurately model "Hey, we've got Messi and maybe the two best Spanish midfielders of this or any generation." But three of my four biggest misses—Barcelona, Bayern, and Dortmund—were their biggest misses (my other big miss was Real Madrid). We both under-predicted the really good teams (in fact, I'm probably under-predicting a little on every team that's half-decent). In other words, we both need to get those teams up top farther to the right, I just need to get them 'more farther' to the right.
Still, Expected Goals isn't worthless
There are a couple of ways to look at this. One, ultimately you want to have a really good model so that you can do prediction and feel confident the results are reliable. However, if both our models are whiffing consistently on the really good teams, then there is something we're still not capturing that would help us better predict those teams. We're missing the information that would make this truly valuable.
The other way to look at it is, "Well, if a team or player is really out-performing the model, that's how we know they are good." Which is fine. But without exactly knowing how or why, you're still left with the problem from above. Think of it as the Alves-Suarez Conundrum. Yeah, you've found a striker who, by ExpG, is off the chart efficient in the Eredivisie, but you're no further along to knowing whether you are buying Alfonso Alves or Luis Suarez. Hot tip: you don't want to buy Alfonso Alves.
So, all ExpG models are garbage and some are even garbagier than others, right? Not necessarily. Look, if you can explain 16.1 percent of the deviance in the movement stock prices in real time, you can retire rich by Memorial Day. And that's to say nothing of the fact that r-squared can be an overly-relied-upon metric itself. People like simplicity. If we can use one number to evaluate something, we'll take that path of least resistance every time, whether or not there is peril in it.
On a per-shot basis it can be useful to put a more precise estimate on a shot than: "There's ~10% chance that it will go in." Shots closer in are absolutely more likely to result in goals, and getting a shot off from a particularly close range is itself an achievement. Knowing that, in a particular game, a team's 20 shots were all really terrible so they should only reasonably expect .31 goals (and not 2-ish) is also valuable if we're trying to get a sense of how well that team played or how truly dangerous they were in attack.
Moreover, I really like my model (as a starting point at least). Some of my coefficients absolutely contain information that could give a team an advantage. In other words, I can put a number on which factors have a sizable impact on the chances a shot goes in, and many of them are extremely statistically significant. And that's part of what we're after. Margins in sports are often very thin. Even just numerical clues as to where to start looking for an edge can ultimately lead to points on the table.
Still, if someone had really nailed it with the ExpG model, then don't you think they would have bothered to trumpet that a bit? The posts I found mentioning r-squared are the ones who went about it in a way that guaranteed a large and meaningless number. The absence of any numbers from other posts where people are saying "I made an ExpG model" is sort of telling in itself.
It's early days for the analyticification of soccer. Part of moving the process along is figuring out what's good and what's bad. At this point, I'd look at ExpG as "marginally interesting, but nothing to get religious about." It's better than nothing, but the extraordinarily complex models don't look to be vastly superior to what you can get if all you knew about a shot was where it was taken. That turns out to be a serendipitous silver lining for Caley and the like who might have made mistakes or taken erroneous shortcuts. Soccer's inherit unpredictability makes it so that just knowing the shot location gets you a hand grenade of an ExpG calculation.
Heck, if you're lazy, just wait until the season's end and multiply everything by .095.
* Ordinary least squares also doesn't apply to logistic regression. But we're not using it. Here r-squared is: 1 - (Residual Deviance/Null Deviance). Still r-squared in logistic regression tends to top out at lower numbers anyway. Even in instances where I've gotten warnings that separation is almost perfect (in other words, I've got a variable that is so close to perfectly predicting 'Is it 0 or 1?' that the application feels compelled to alert me in bright red text it thinks something might be wrong), r-squared still only comes in at .7-something. Point being it's generally hard to predict binary events with really good certainty.
** In all, I looked at four different models. The first was just the two-term linear model discussed at the top of the piece (technically, it's three term, but the third term was an interaction between the distance and the visible angle). For the remaining, I did model selection three different ways. First, I ran a gamma lasso and did model selection using AICc. Then I ran a cross validated lasso on the same dataset and did model selection first using minimum deviance, then using +/- one standard error. The latter two gave way conservative models, moreover the r-squared were also little better than the two-term model (~.130). This is non-trivial as doing cross validation you get an r-squared on out-of-sample data, which, ultimately, is what we really want to know.
*** By sheer coincidence the Sloan paper also uses the 'dumb' model in their paper (although it's .096 in their data). I had actually finished the copy here before I read their paper. Judging from the fact that they had access to Prozone data, which has information on defenders at the moment a shot was taken, I was absolutely expecting their model to be vastly superior. It's not apples-to-apples, because the source data is different, but the average error in their best model does not seem to be appreciably better than what would be the equivalent best model for us.
Michael Bertin is a writer and data enthusiast. You can follow him on Twitter @bertinbertin, but it's mostly him complaining about another late game Arsenal capitulation.
Image via Getty
Related


Clemson's 2026 Season Could Define Dabo Swinney's Future


2026 Home Run Derby Props: Three Best Bets for Monday Night

Ranking Three No. 2 Wide Receivers Better Than Stefon Diggs

Why MLB's Move of the Home Run Derby to Netflix Hurts Fans

Conor McGregor Lets UFC Momentum Slip Away at UFC 329
- Home Run Derby 2026 Picks, Odds and Predictions for Monday Night
- World Cup quarterfinal best bets: England vs. Norway, Argentina vs. Switzerland
- UFC 329 predictions: Best bets for Conor McGregor vs. Max Holloway
- Spain vs. Belgium Best Bets: Three Picks for Friday's World Cup Quarterfinal
- MLB Picks Today: Jack Flaherty, Aaron Nola Strikeout Props for Phillies vs. Tigers
- France vs. Morocco Best Bets: Top Picks for World Cup Quarterfinal Clash
- Big 12 Sleeper Picks: Three Teams That Could Win the Conference in 2026
