
How Do The Most Common NFL Scores Compare To Soccer?

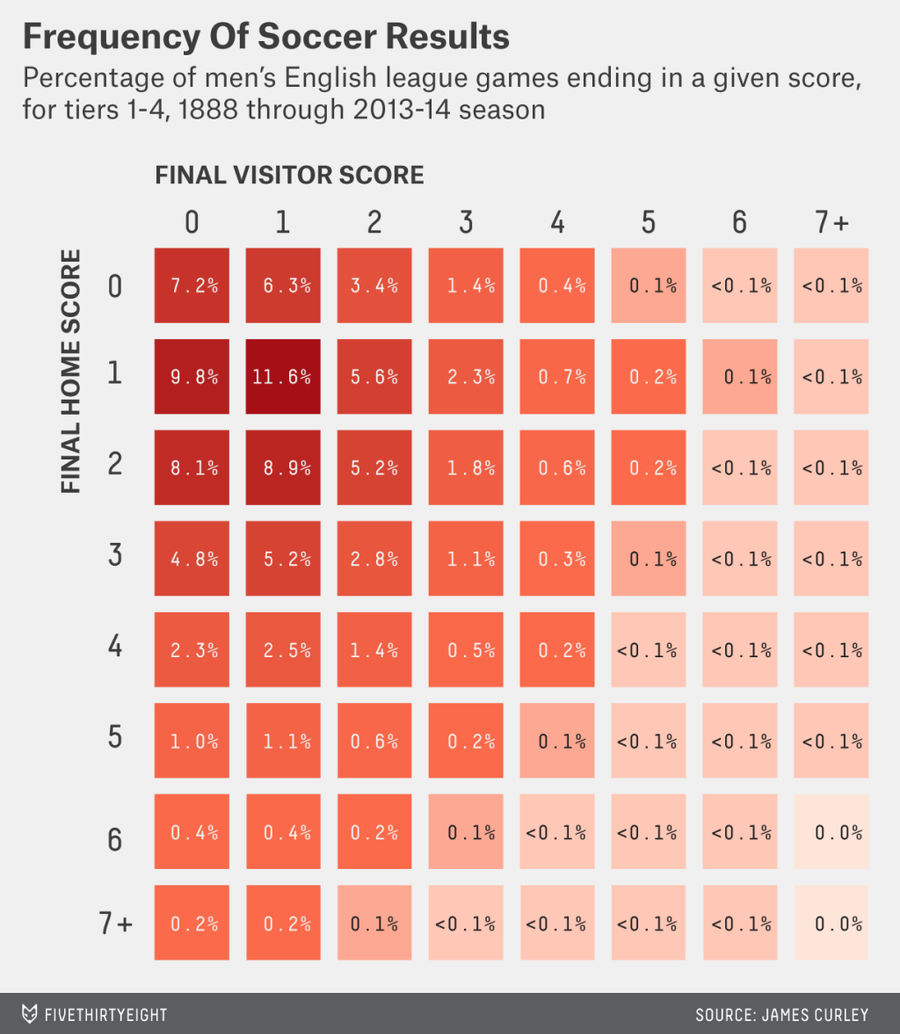
On Friday, FiveThirtyEight ran a post that collected data on nearly 200,000 English soccer scores from the last 126 years. The most common score was a 1-1 draw, there were more than 13,000 0-0 draws, and an alarming number of games where one side didn't score at all. The most common reaction was that this was confirmation that, taken as a whole over the last century, soccer really is sort of dull. That in mind, a redditor called TortiseWrath made a similar graphic for all NFL scores since 1970.
First, here's the chart from the FiveThirtyEight post:
And here's the graphic from reddit:

You'll want to at the very least click the Expand button on that image, or probably open in a new tab. You can find a version with raw totals instead of percentages here.
With how football is scored, the scores bunch differently than a sport like soccer. Its most common score is 20-17, which occurs 1.11 percent of times with the home team winning, and 0.89 percent of time in favor of the visitor. And as a whole, visitors fare much better in the NFL than they do in English soccer.
There are a few issues with the comparison, since ideally you'd go back to the beginning of the league's days in 1920. But this is a pretty straightforward visualization of scoring in modern football.
[ reddit]


- NBA Best Bets Today: Top Betting Picks for Monday March 30th
- Michigan vs Tennessee Prediction: Why Wolverines Are the Elite 8 Best Bet
- Top NBA Bets Today: Expert Picks for March 29 Slate
- UFC Seattle Predictions: Adesanya vs Pyfer Main Event Betting Picks and More
- Arizona vs Purdue Elite 8 March Madness Betting Picks, Prediction
- NBA Picks for March 27: Best Bets for Friday Night Slate
- Why St. John's Can Cover Sweet 16 Spread Against Duke
