
NBA Court Factors: How Assists Aren't As Unbiased As You Think

There will never be any question over what it means to have scored 25 points, or recorded a number of rebounds, blocks, or steals. Sure, if we've learned anything in the age of analytics it's that raw stats can be misleading—they fail to account for pace or efficiency—but at least they are facts. Russell Westbrook's 111 offensive rating is amazing to me given the number of shots he's taking, but it's an abstraction. His league-leading 27.5 points per game? Those are absolute. If you can't always find truth in the box score, you can at least find a set of facts. Mostly, that is.
When it comes to the box score statistics, we take the factual nature of the assist somewhat for granted. It goes right next to the point and the rebound, two very clearly defined outcomes. But the actual act of dropping dimes is far less concrete than it seems. Check this definition, from NBA.com:
An assist is a pass that directly leads to a basket. This can be a pass to the low post that leads to a direct score, a long pass for a layup, a fast break pass to a teammate for a layup, and/or a pass that results in an open perimeter shot for a teammate. In basketball, an assist is awarded only if, in the judgement of the statistician, the last player's pass contributed directly to a made basket. An assist can be awarded for a basket scored after the ball has been dribbled if the player's pass led to the field goal being made.
(Emphasis mine.)
There's lots of room for interpretation in this definition, and it's easy to see how two different scorers could see the same basket and differ on whether or not an assist should be given. This is how Nick Van Exel wakes up with 23 assists one morning, or how Shareef Abdur-Rahim becomes an absolute monster at home. To demonstrate just how fluid the assist can be from arena to arena, I've borrowed a concept from baseball statistics: the park factor, or in this case, the court factor.
The varying dimensions of MLB fields can have wild impacts on a number of stats, but most obviously, the distance of fences from home plate wreaks havoc on home run numbers. When Curtis Granderson moved from the Tigers to the Yankees, for example, his home run rate exploded, and in his first injury-free season in New York in 2011, Granderson hammered 41 home runs, besting his previous career high by 11. Yankee Stadium's park factor for left-handed home run hitting is 117, according to FanGraphs—below only the launching pad that is Coors Field (118)—well above the average of 100. Granderson always had good power, but good power only made him a 20-30 homer player at Comerica Park, a park that has been effectively typical for left-handed power hitters with an even 100 park factor. Granderson didn't necessarily see an inexplicable boost in power as a 30-year-old in New York. He was simply playing more games at a park that favored his skillset.
There would seem to be less room for deviation on a basketball court. Every court in the league is 94 feet long and 50 feet wide, every hoop 10 feet off the ground, and every three-point line uniform with every other in the league. But given the nature of accounting assists, each arena actually has a measurable and relatively persistent effect on assist numbers.
For my court factors, I looked at assists per made field goal (in order to eliminate pace). The (simple, un-regressed) formula is:
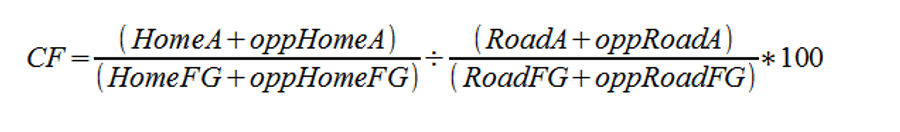
Thus, the total assists per field goal (for and against) for each team at home is divided by the total assists per field goal for that same team on the road. Although not every team will play the same brand of basketball at home and on the road, combining the results of both squads in each game helps isolate what we're trying to examine here: the likelihood a scorer at an individual arena will score a made basket as assisted. It also accounts for the typical eight percent rise in assists when a team is playing on its home floor, as it is captured on both sides of the equation. The necessary data for this calculation was taken from the team splits pages at Basketball-Reference, like this one. I examined data from the 2009-10 season to the current season. This year's data is accurate through March 1.
The results:
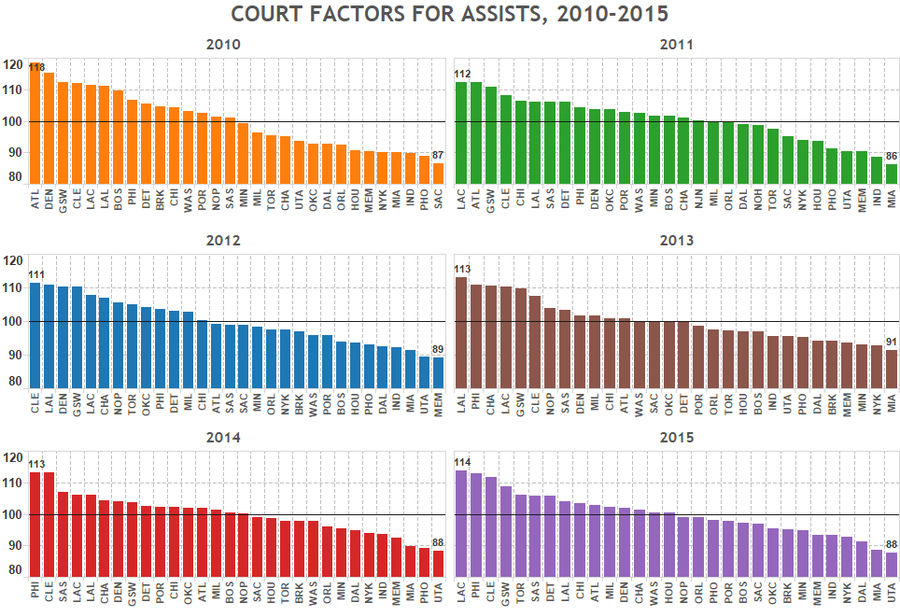
My takeaways
In a typical year, 80 percent of the league's arenas have a court factor between 90 and 110. There is, unsurprisingly, substantial agreement on what makes an assist. But the disagreement is big enough that in each season there is at least a 20 percent difference between the top assist-giving teams and the stingiest. LeBron James serves as a convenient example of the differences, as he has played at both ends of the spectrum in Cleveland (112 court factor in both 2010 and 2015) and Miami (no court factor above 91 during James's tenure).
The drop in LeBron's assist rates in Miami were one of the reasons why I first started this research back in 2012 when I was working for the fantasy sports company RotoWire. It didn't make much sense to me—LeBron had gone from playing for a team with a supporting cast so terrible it turned Mo Williams into an All-Star to playing next to Dwayne Wade and Chris Bosh. But somehow his assist rates (measured as the percentage of field goals made by teammates assisted by James) in Miami were closer to his marks as a raw 20 and 21-year-old than the Point Forward God we had seen in James's final couple years in Cleveland. This didn't really make sense. The trend has continued this year as James, now back in Cleveland, has rebounded to a 37.9 percent assist rate, just about tied for the second highest of his career.
But account for the court factors (halve the court factor to account for the schedule split and divide the assist rate by the result), and the numbers make a little more sense. Observe:
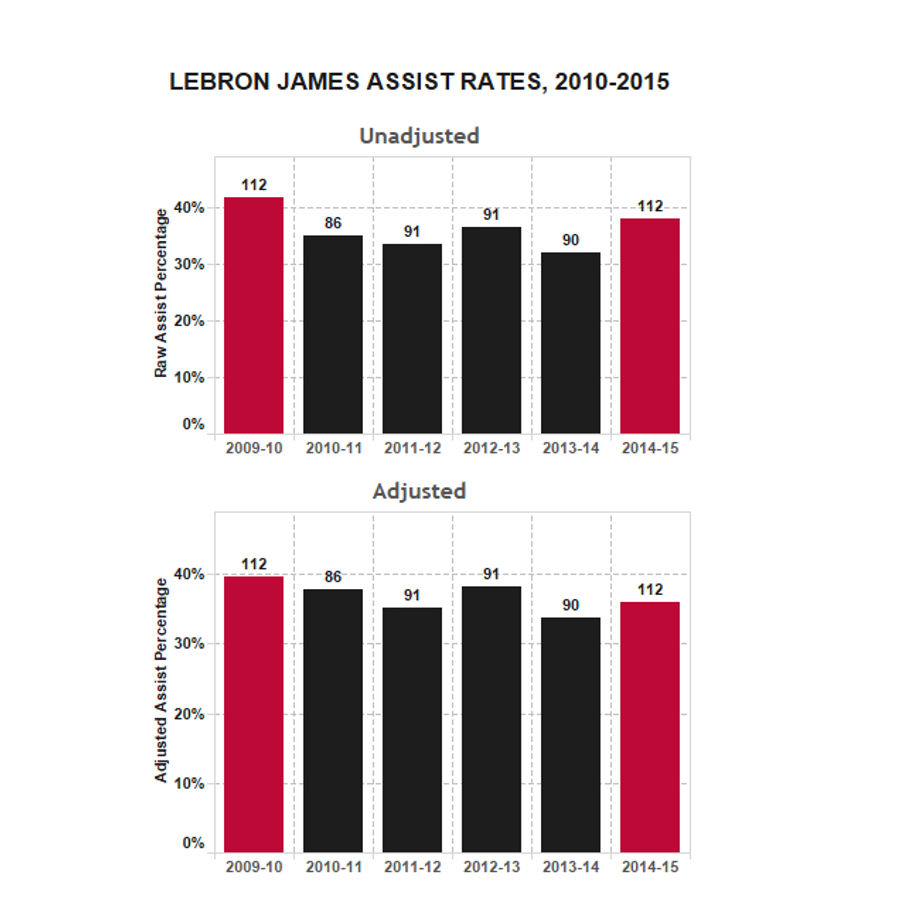
The number on top of each bar represents the court factor from James's home arena that season. The adjustment is subtle, but looking at James's last six seasons accounting for court factors, this year now ranks behind 2009-10, 2010-11 and 2012-13, with 2011-12 and 2013-14 not far behind. LeBron has always been an elite assisting forward, but it's been skewed a bit at both of his home arenas. It's not like he forget how to assist or became more selfish in Miami. That's just how they see assists there.
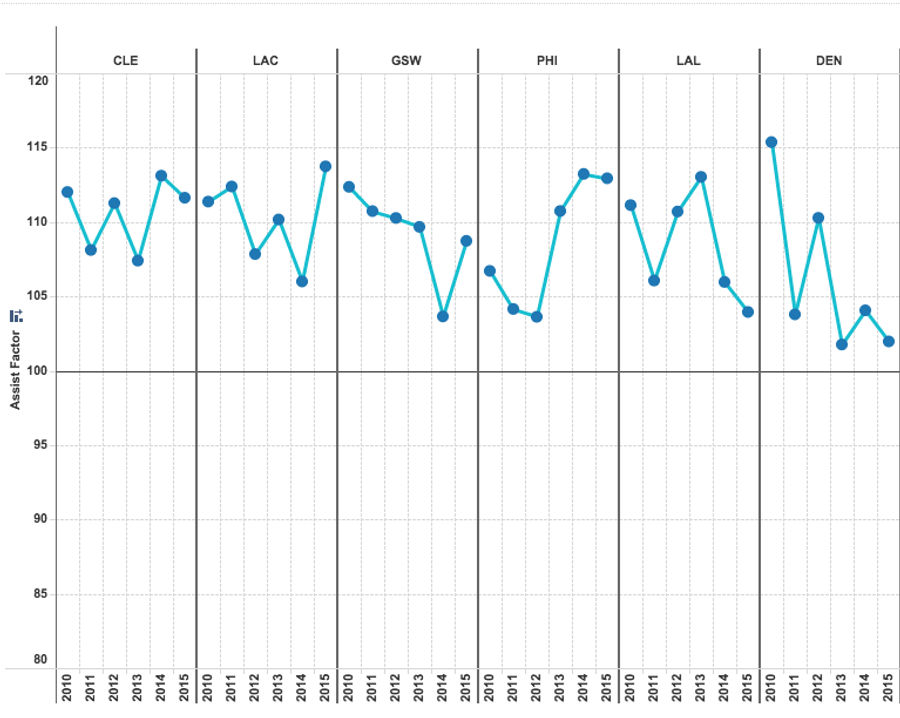
Like Miami and Cleveland, most arenas are relatively consistent on a year-by-year basis. Six teams (CLE, LAC, GSW, PHI, LAL, DEN) haven't dropped below 100 since 2010, and seven (DAL, NYK, PHO, IND, MEM, MIA, UTA) haven't finished above 100. But not all arenas are so consistent. The Hawks and Nuggets have gone from assist-happy arenas to relatively neutral since the peaks of the Joe Johnson-Josh Smith and Carmelo eras, respectively. The 76ers have been one of the most assist-happy teams since Sam Hinkie took over in Philadelphia. The Charlotte franchise has been all over the map, perhaps not surprising considering the regular turnover in their coaching and front office staffs.
Below is a chart showing how the six arenas with the highest court factors have changed of the last six years. You can view an interactive of every arena's court factors over that time here.
The subjective nature of assists allows for intentional fudging on top of the natural disagreement that exists with any statistic left to judgment. The court factors alone aren't going to be enough evidence that scorers are tampering (or being told to tamper) with their team's statistics. For instance, it's tempting to suggest the Clippers are propping up Chris Paul's assist total with their high assist factors, but their high assist factors predate Paul's arrival in LA. Philadelphia's high totals under Hinkie are suspicious after he just made a big trade involving a point guard averaging 7.4 assists per game in Michael Carter-Williams (who is averaging 6.1 assists in seven games for consistently neutral Milwaukee), but again, Philadelphia has been at least a slightly assist-heavy arena in all six years in the dataset.
That said, there is almost certainly some intentional fudging going on in NBA assist recording on a nightly basis. In 2009, Deadspin talked to a scorekeeper who estimated the typical NBA game has some 20 unintentional errors and "over double that in intentional errors." The scorer worked for the then-Vancouver Grizzlies in the late 1990s and was largely responsible for Van Exel's aforementioned career-high 23 assists in a 1997 romp in Vancouver.
There are plenty of reasons why teams would want to skew assists either way. A team looking to extract value from its team in trades would want to pump up its assist values. On the other hand, a team looking to re-sign young and talented players on the cheap may want to deflate assists to lower the player's leverage in salary negotiations. And our Nick Van Exel fan above was praised by Grizzlies staff for making his huge night possible, as one senior management staffer told him, "Great job Alex, that'll get this game on Sportscenter tomorrow morning!"
Alex notes the assist isn't the only stat that can be fudged: dead ball rebounds that should be recorded as "team rebounds" often become attributed to the player closest to the play, blocks can be switched between two players close to the basket, steals can be given to the wrong player when the ball pinballs around before somebody scoops it up. But there is certainly a spectrum here—points are so obvious it's almost impossible to fudge unless there's a questionable putback or tip-in, whereas the wholly subjective nature of the assist means what might look like an "intentional error" to one observer might just be a difference in opinion over what the assist actually means.
And that's not nothing. While the the absolute rule of the box score has waned, the meaning of what it contains has only grown in importance. Basketball statistics are becoming incredibly advanced; the dataset available from SportVU combined with the game's existing play-by-play and box score data gives analysts more than they can possibly know what to do with. But many of the most sophisticated stats still rely on the foundations provided by the box score: points, rebounds, blocks, steals, and yes, assists. The foundational assumption is that these facts can be applied to their context, and produce something like truth in the form of advanced stats like PER, win shares, or offensive rating. But as long as the basketball's statistical bedrock runs through a single scorekeeper at every arena, some part of that truth will only be as good as the home court allows.
Jack Moore is a frequent contributor to Vice Sports and Hardball Times. Follow him on Twitter here. Photo by Rob Carr / Getty Images Sport.
Related


- Best NBA Betting Picks and Predictions for Monday April 6th
- National Championship Bet Pick: Why Michigan Has the Edge Over UConn
- UFC Vegas 115 Betting Picks: Moicano vs. Duncan Headlines April 4th Card
- NBA Betting Picks April 4th: Three Best Bets for Saturday's Slate
- Michigan vs. Arizona Bets: Wolverines Hold Edge in Final Four Showdown
- Best NBA Betting Picks Today: Friday April 3rd Expert Predictions
- MLB Pitcher Props Today: Best Baseball Bets for April 3rd
