
A Quick Look At Perfect Games Vs. No-Hitters Throughout MLB History

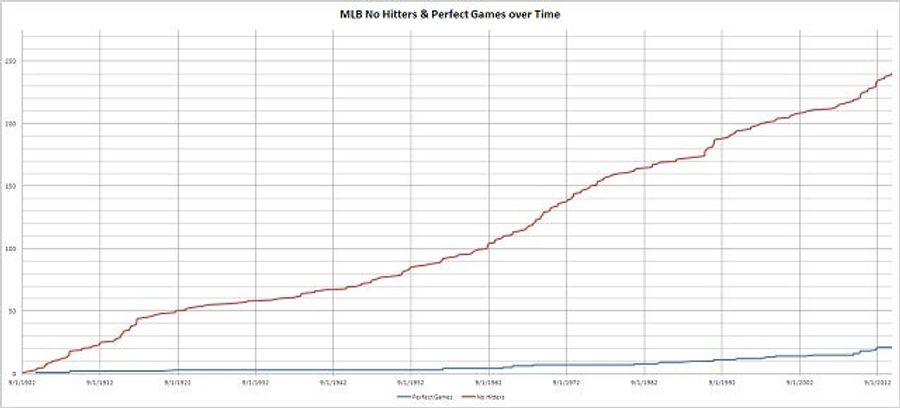
On Wednesday Clayton Kershaw threw the 283. What separated Kershaw's no-hitter from becoming a perfect game was a throwing error by shortstop Hanley Ramirez in the seventh inning that allowed the only Rockie player all night to reach first. T he chart above, which comes from Redditor thessnake03, tracks no-hitters and perfect games since 1902 when the modern era arguably started.
Kershaw's no-hitter falling short of becoming a perfect game is no rarity. There have been 283 no-hitters but only 23 perfect games. But since the above chart is cumulative and the two grow at such different rates, it's hard to see anything but no-hitters outpacing perfect games, which, obviously.
That isn't to say the rates don't move around. The steepness of the red curve shows no-hitters occurred quite frequently during the 1960s and 1970s. Which is when Nolan Ryan and Sandy Koufax were racking them up. In recent years, no-hitters have been on the rise as well. Kershaw's was the 21st since 2010.
Perfect games have increased lately too, with five being thrown since 2010. Both perfect games and no-hitters have increased as pitchers became more dominant. Since the mid-2000s strikeouts have increased while home runs, runs, hits, and batting averages have declined. Overall, since 2010, no hitters have occurred in 0.09716% (21/21612) of games, while perfect games occured in 0.02315% (5/21612).
[ Reddit]
Related


- Best NBA Betting Picks and Predictions for Monday April 6th
- National Championship Bet Pick: Why Michigan Has the Edge Over UConn
- UFC Vegas 115 Betting Picks: Moicano vs. Duncan Headlines April 4th Card
- NBA Betting Picks April 4th: Three Best Bets for Saturday's Slate
- Michigan vs. Arizona Bets: Wolverines Hold Edge in Final Four Showdown
- Best NBA Betting Picks Today: Friday April 3rd Expert Predictions
- MLB Pitcher Props Today: Best Baseball Bets for April 3rd
