
Infographics: Every NFL Offense's Production, Visualized By Position

Instinctively, you know every team has strengths and weaknesses. You see it in the box scores and the advanced metrics, but when the teams line up, a shitty running back doesn't look impossibly different from Adrian Peterson. So, here's a visual aid. Every NFL offense, visualized by how each of the main offensive positions are playing.
Each circle in these charts represents how productive that position has been for a given team. We added up every qualifying player's DYAR at a given position—so you're not just looking at single players, but whole units. (LeSean McCoy is the single best running back, for example, but the Denver backs are a better unit.) Bigger circles mean more production. Red circles mean below replacement level play. So, a big red circle means that that position really sucks.
If you're unfamiliar, DYAR stands for Defense-Adjusted Yards Above Replacement. It's a Football Outsiders metric that compiles the total value a player generates over the course of a year, instead of the slightly better known DVOA. Broadly, we're using DYAR because we wanted to show how much production each team has gotten from each of its positions, not how well each player has played in whatever snaps he was on the field for. (DVOA is a rate stat, like the NBA's PER, meaning a highly productive five plays would set you ahead of league leaders. We aren't so interested in that here.)
The "defense-adjusted" in DYAR means that these numbers reflect the quality of opponents each offense played. The thing to note is that because we're only four weeks into the season, the opponent adjustment isn't really kicking in yet. It increases 10 percent every week, and is at full confidence by week 10. It's at 40 percent this week, which isn't the strongest, but is better than no adjustment.
The minimum qualifying criteria were 10 passes for quarterbacks, five targets for receivers, and six carries for running backs. DYAR was also useful here because we could combine rushing DYAR and passing DYAR for quarterbacks, rushing DYAR and receiving DYAR for running backs, etc. For the offensive line, we used adjusted line yards, which is a rushing metric, instead of pass protection. We did this because many of the passing stats, at least this early, seemed more predicated on a quarterback's ability to avoid sacks than we'd like, but we're open to suggestions.
We didn't do defense this time around, because, frankly, we didn't have the most compelling data to work with. We're going to see about getting something together for that.
Average Squad
Here's the NFL average for accumulated DYAR of a team's receivers, tight ends, running backs, and quarterbacks through Week 4, and the average adjusted yards gained by the offensive line:

We set the positional bubbles to be the same size–everyone already knows that elite QBs can have the largest impact on offensive play–so we could see how each teams different corps performed compared to the average at that position. Below is the best offensive unit in the NFL, a Frankenstein's monster of the best bits squads on the strongest offensive teams.
Best Possible Squad

Going through the teams one by one, all figures are scaled down from this max chart. Below is DYAR by position for all 32 NFL teams, ranked by their offensive DVOA. Negative DYAR values, if a squad is performing below a replacement level, are show in red.
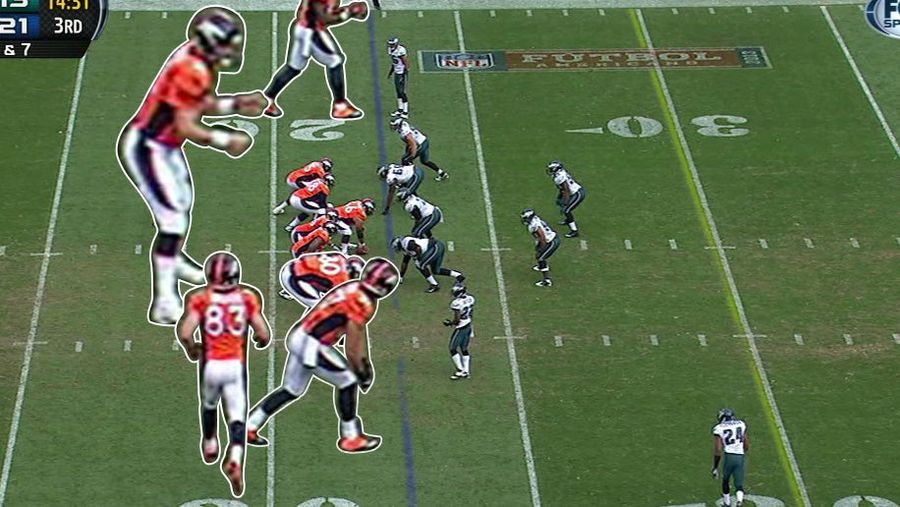
1. Denver Broncos (Offensive DVOA of 53.2%)

2. San Diego Chargers (33.1%)

3. Green Bay Packers (30.7%)
Figures increased 33% to account for the Week 4 bye.

4. Indianapolis Colts (19.1%)
Trent Richardson's stats for the full season are represented.

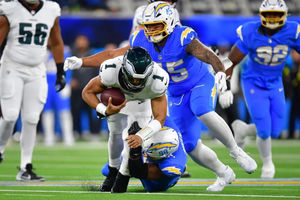
5. Philadelphia Eagles (18.7%)

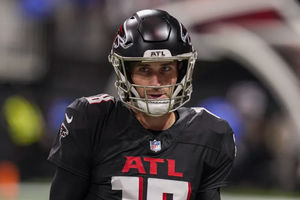
6. Atlanta Falcons (17.7%)

7. New Orleans Saints (15.4%)

8. Carolina Panthers
Figures increased 33% to account for the Week 4 bye.

9. Seattle Seahawks (6.6%)

10. Dallas Cowboys (6.0%)

11. Kansas City Chiefs (5.3%)

12. Detroit Lions (4.7%)

13. Miami Dolphins (4.5%)

14. Tennessee Titans (4.4%)

15. New England Patriots (2.6%)

16. Washington Redskins (0.8%)

17. San Francisco 49ers (0.6%)

18. Minnesota Vikings (-0.6%)

19. Chicago Bears (-0.6%)

20. Cincinnati Bengals (-1.5%)

21. Buffalo Bills (-4.7%)
Results of last night's game are not included.

22. Houston Texans (-4.8%)

23. Pittsburgh Steelers (-5.9%)

24. Oakland Raiders (-9.1%)

25. Arizona Cardinals (-17.6%)

26. Baltimore Ravens (-18.0%)

27. Cleveland Browns (-18.3%)
The results of last night's game are not included.

28. St. Louis Rams (-20.9%)

29. New York Jets (-24.3%)

30. Tampa Bay Buccaneers (-24.6%)

31. New York Giants (-24.7%)

32. Jacksonville Jaguars (-67.1%)

Worst Possible Squad

Related


- NBA Best Bets Today: Top Betting Picks for Monday March 30th
- Michigan vs Tennessee Prediction: Why Wolverines Are the Elite 8 Best Bet
- Top NBA Bets Today: Expert Picks for March 29 Slate
- UFC Seattle Predictions: Adesanya vs Pyfer Main Event Betting Picks and More
- Arizona vs Purdue Elite 8 March Madness Betting Picks, Prediction
- NBA Picks for March 27: Best Bets for Friday Night Slate
- Why St. John's Can Cover Sweet 16 Spread Against Duke
