
This Year's Super Bowl Teams Really Are The Best In Their Conference

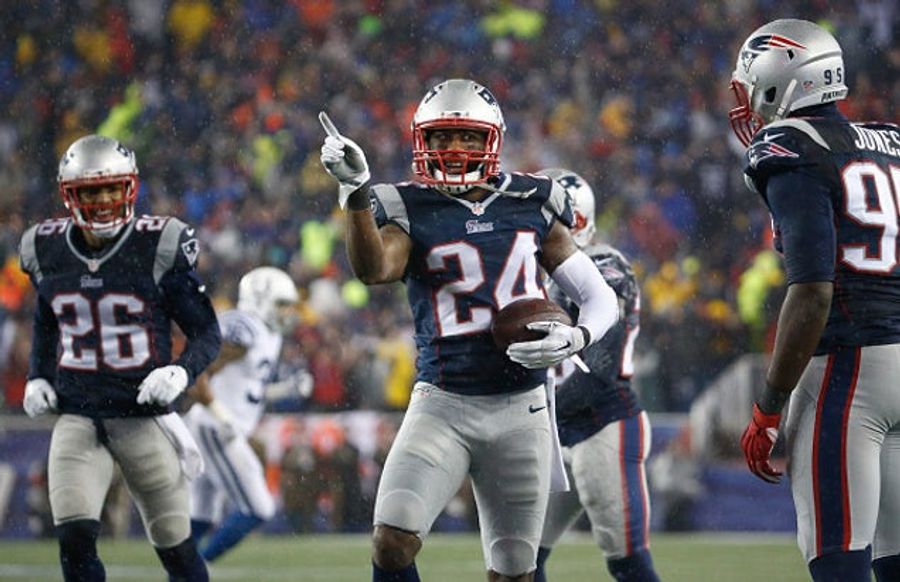
Hey, here's a change. The participants in this year's Super Bowl, through the NFL's single-elimination playoff format, were actually the best in their respective conferences this year. That never happens! Except, uhm, when it happened last year. But otherwise—that almost never happens!
According to Pro Football Reference data, both teams in the this year's Super Bowl rank (or at least tie for) first in their conference in win percentage, point differentials, and SRS, which takes into account strength of schedule and measures teams' expected victory margin against an average opponent. This has only happened five times since 1970 merger. And has only happened twice since 1990 when the playoffs expanded, with the other time being last season. We're witnessing the first time there's been back-to-back Super Bowls where both teams stand out among their conference like this. The table below lists each Super Bowl since 1970 and the average winning percentage, point differentials, and SRS rank of the teams involved, sorted by their average score across the three measures.
The average conference ranks of Super Bowl teams are: 1.69 winning percentage, 2.27 point differentials, and 2.46 SRS, with an average rating of 2.14 across these three metrics. The worst teams to make a Super Bowl, as seen in the bottom of the chart, generally come from recent years because playoff expansion now allows for teams to make the Super Bowl that wouldn't have even made the playoffs in previous years. Like the 2008 Cardinals, who had an average rank of 5.83 across winning percentage, point differentials, and SRS, yet damn near won the Super Bowl. But don't put too much stock into high-profile matchups. Just because the very best from each division only play each in the Super Bowl about once every nine years on average, doesn't mean the game will live up to expectations as seen in the ass kicking Denver received last year. Meanwhile, many of those games on the bottom of the chart were exciting as hell.

Biggest NBA Playoffs Concerns for Contenders Outside OKC


Five WWE Superstars in the Spotlight Ahead of Wrestlemania

Best NBA Betting Picks and Predictions for Monday April 6th
- National Championship Bet Pick: Why Michigan Has the Edge Over UConn
- UFC Vegas 115 Betting Picks: Moicano vs. Duncan Headlines April 4th Card
- NBA Betting Picks April 4th: Three Best Bets for Saturday's Slate
- Michigan vs. Arizona Bets: Wolverines Hold Edge in Final Four Showdown
- Best NBA Betting Picks Today: Friday April 3rd Expert Predictions
- MLB Pitcher Props Today: Best Baseball Bets for April 3rd
- MLB Picks Today: Brewers vs Rays and Reds vs Pirates Predictions
