
Two Days At Sloan: How Sports Analytics Got Lost In The Fog

"You're hiding all the good numbers from me."
Dean Oliver, head of ESPN Stats & Info's analytics division, is sitting in on a panel ostensibly pointed at figuring out what an analytics-based approach to selecting the college football playoff participants would look like, but which has so far come off more like a highbrow Around the Horn segment. Right now, the panel and audience are voting between teams based on ESPN-generated metrics like adjusted strength of schedule and win probability average for games. Oliver is asking about adjusted win probability averages, which aren't listed, but which he seems to prefer to what we've got up on the screen.
"Yeah, there's many more numbers [on ESPN.com], we should emphasize," says Alok Pattani, the Stats & Info specialist running the exercise. "We've limited down for the presentation."
And there, in a brief exchange not three hours into MIT's eighth Sloan Sports Analytics Conference, is the essential problem of Sloan as it approaches adolescence. Where was the good stuff?
On one hand, in this instance, it's a smart production instinct—it doesn't do a casual audience a lot of favors to halt the proceedings for an explanation of adjustments to metrics that themselves had only just been explained, and which are really only one facet of the discussion. On the other hand, well, what's an analytics conference supposed to be about?
The panel, like the other larger productions at Sloan, is being held in a spacious ballroom at the Hynes Convention Center in Boston. Its organizing idea so far has been a particular cogent observation by Oliver, which is that "best" and "most deserving" are two completely different things when it comes to ranking teams for inclusion in a playoff. Addressing both separately, instead of trying to cram them into one metric, is a perfectly sensible thing to do, and for this, ESPN has brought all its considerably weaponry to bear. Oliver and other senior analytics staff have spent the last two years immersed in college football, which has lagged behind other sports in statistical sophistication.
This is the benefit of being able to point ESPN at a problem. As data guys go, Dean Oliver is as good as they come. In 2002, he wrote Basketball on Paper, one of the foundational books on basketball analytics; two years later he became the first analytics consultant in the NBA with the Sonics, and later he was part of the team that decided to trade for Iverson in Denver. He pulls off a kind of smartass Socratic approach without ever dipping into dickishness—harder than it sounds—and since 2011, he's been in charge of coming up with new stats for ESPN. The two main college football stats he's helped pioneer are the Football Power Index (FPI) and Championship Drive Ratings (CHAMP); these are notable because they actually seem to be good, and also because, despite having been featured over the past year, no one seems to have any idea just what the fuck they are.
In a practical sense, everyone knows what strength of schedule means. If Auburn were to transfer to Conference USA next season and lay waste to Tulane, Tulsa, Rice, and Middle Tennessee, you would of course understand that this is less impressive than whatever Auburn would do in the SEC. Years before, a parabolic network of scouts, coaches, executives, and handicappers came to some mean consensus on the 16-year-old linebackers they liked most, and which offensive guards they liked less, and that in turn informed recruiting, which affected offseason workouts, which goosed pre-season polls, which shaded point spreads, which framed expectations, and those expectations are some large part of which schedules we decide are strong. In a more finite league, like the NFL, simply adding up your opponents' records is basically good enough to weight your schedule, but that doesn't fly with college football, where a team will play against less than 10 percent of the I-A teams.
ESPN's strength of schedule manages this in an intuitive, understandable way, by showing how likely an "average" team and an "average top 25" team would be to have the same record as another team. It then marries it to a "dominance" rating that represents a team's average win probability at any point in all games. This separates out similar final scores. If one team goes up 35 points five minutes into the first quarter, then subs everyone out and wins by 42, that's much different from a game that's contested into the second half until one team finally breaks away and wins by 35 in garbage time. All of this is useful and interesting, all of it totally in the realm of knowable. All of it, along with a few odd variables, is then run through the ESPN blender, and belched out as two catch-all stats, CHAMP and FPI.
This is why we are here, at Sloan, in the audience for a panel that is essentially a user manual for a set of year-old college football stats. It's also probably why Oliver was asking for the "good numbers," which are far more telling before they're duct-taped together to churn out the one number you need to know.
But we haven't really talked much about CHAMP and FPI during the football playoff panel. It's been more focused on how the individual SOS and dominance numbers are good tools for committee members to look at, if they want. It's enough to make you wonder why ESPN would even bother with the catch-alls. Then, suddenly, Rece Davis, Mark May, and Lou Holtz are bellowing down at the audience in Ballroom A at the Hynes from two giant screens, projected on either side of the room, howling about who the best team in the country is. "Alabama," says a grinning Holtz. "They're the best team in the country, they don't have the best record—that's the problem." After a minute or two of this, Davis turns on his heel—Jeff Bennett, a Stats & Info director, preens, "We've successfully brainwashed Rece to take from college football right into college basketball"—and plunges the same discussion into college basketball. "There's a difference between most deserving and best. Here's the question I'm asking you: Who's the best team, Syracuse of Florida?" Oh, you realize, as visions of Baylesses dance through your head.
It's an open secret that the ESPN analytics team generates far more data than it makes public, and certainly more than make it onto TV. "We're still a TV company first," many analysts will tell you in private moments, when you ask about stuff that only lives on "dot com." This means that anything that isn't generated for a specific story will get dumped into what's called an NST (notes, stats, trends) pack, and sent out as notes to anchors. If you really like an item, you might phrase it in 140 characters or less, to make it tweetable, though those often go unclaimed as well. You learn whom to pitch to (Kirk Herbstreit is great; Jay Bilas is a sponge) and whom to avoid (maybe stay away from Corso). It also means that sports that aren't going to translate to TV—say, the NHL, to which ESPN holds zero rights and whose metrics are essentially adding up all the shots a team takes—will be all but ignored. And sports like soccer, which are less popular in the U.S., will be tracked closely, but relatively simple "advanced" stats, like turnovers or possession-by-thirds, stats that serious fans would kick out their mothers' teeth to have on hand, are never made public, because it just isn't worth the time or headache of upkeep.
That isn't evil; it's just good sense. ESPN is not a statistics-generating non-profit put on Earth to further our understanding of sports. But it is the tension at the heart of the entire conference: TV personalities using numbers and concepts with their edges sanded down, a platform (panel, conference, network) that often insists analytics are dichotomous with all other forms of knowledge about sports, and an audience full of experts wondering where all the good numbers are hiding.

"Are you being cagey or are you being vague?"
Jeff Ma, bless his patient heart, is moderating the sports betting panel for the second year running. Ma, a member of the original Bringing Down the House MIT blackjack team, is tasked here with drawing river bets out of a panel of rocks, one of whom seems to be calling himself the "Sports Boss." If sports betting is your thing, there's plenty of good action on the subject at Sloan. You just won't find it in a panel.
One of the less publicized quirks of Sloan is that, however useless the main panels become, you can't swing a graphing calculator without hitting a professional gambler. (Tip: He's probably the guy wearing a generic "Sports Analyst" nametag.) Sharps have been skulking around the conference for years, looking for an edge at the frontiers of analytics. Early on in Sloan's life, they found that with guys with Ken Pomeroy and Daryl Morey; but as the conference has degenerated into a sort of TED Talks in cleats, many have realized that the work they're doing on their own is ahead of most of what's talked about on-stage at Sloan now, and so the information exchange has shifted from taking notes at the keynote to grabbing a drink with some other degenerates and seeing who wants to trade horses.
Saturday night at the Sheraton Hotel bar, just down the hall from the convention center, some of the sharpest money in the world is sitting around a table, knocking back Harpoon IPAs. This is one of two times a year that this crowd gets together, the other being the launch event for the Las Vegas Hilton's NFL SuperContest. Park yourself in the same seat for five or six hours, and an entire cosmos of sports gambling will swirl by. Guys (like most of the crowds at Sloan, they seem to be almost universally men) who are known as either the top or among the top in college football, college basketball, tennis; handicappers, model builders, bookmakers; guys buying up and trading other guys' debt, or just trading in rumors and informed hearsay about one industry cockup or another. Most aren't interested in talking on the record.
These are the guys who don't want to their names in the streets. They don't want to be on podcasts, or quoted in articles, or to amass a following on Twitter. Hell, most of them don't even live in Vegas, instead playing online books here and there, and finding local bookies who will take their bets (usually so they can bet those picks themselves at higher stakes). But they do want to be seen—because being seen can mean acquiring more information. And more information in turn means you can place more bets, which, if everyone is doing their jobs, means more money. (One of the misunderstood things about sharp sports betting is that getting money down in the first place is half the battle. In softer markets, you're fighting against max bet limits, and sometimes a limited board. You aren't making a living betting $500,000 on a game; you're more likely grinding out wins betting a $1,500 unit on 12 college basketball games a night.) It takes a long time to build up credibility in these circles, but if you're known to be very, very good and very, very reliable at just one thing—WNBA totals, college basketball second halves, in-game tennis trends, whatever—you can turn your edge in one sport into an edge on every corner of the board; sharing your six playable picks in mid-major college ball to your new friends returns you picks in the NBA, ATP tour, MLS, or even the ponies.
They also just like the chance to talk shop and catch up on gossip with a group of peers. It's sort like ComicCon in this respect. Every tribe that turns out in any numbers will revel, in their own way, in geeking out over things that most people in their lives will never understand, let alone obsess over. Drop in on the group of football writers winding down after the first day, for example, and you'll find them breaking down how to properly chart a game—there are more conflicting definitions about what goes into a "pass pressure" and a "hurry" than you'll ever know—or which schools are terrible about noting run direction properly, or why in the world three more teams would be moving up to I-A this year. They also, of course, love talking trash about who's doing what wrong and how. This year's football analytics panel was a special kind of mess—several people I talked to openly questioned whether Kevin Kelly, "The High School Coach Who Never Punts," was citing flatly incorrect probabilities—and left most wondering why you'd run that noise up on stage and leave smart guys like Football Outsiders' Aaron Schatz to rot in the audience, tweeting their disapproval.
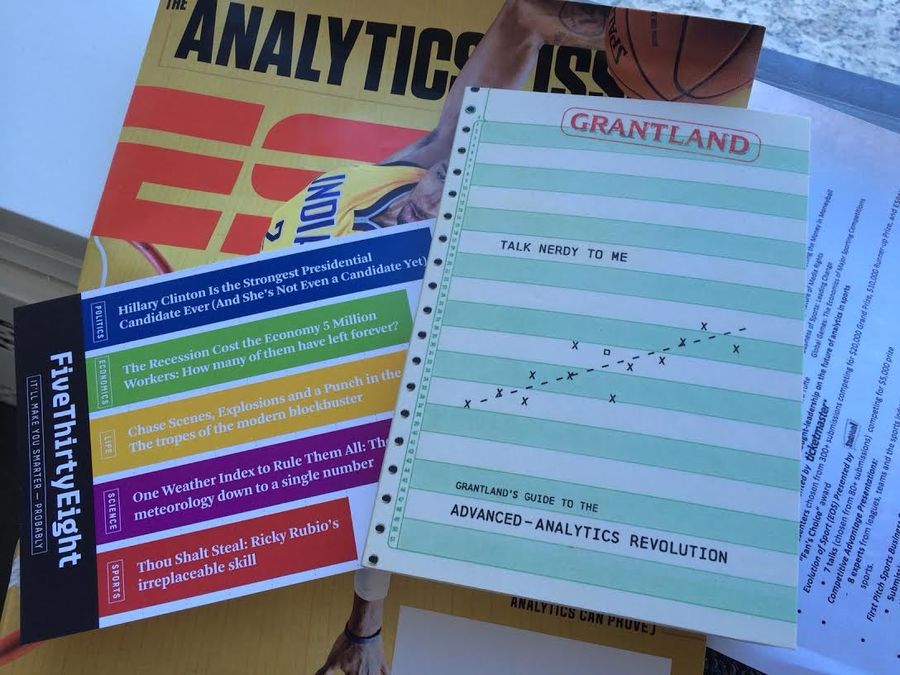
The swag bags at Sloan.
About those panels: At the moment, Jeff Ma is trying to get his panel to talk about which stats they think are most useful, and they aren't giving up much. "Average yards per play," mutters one; "yards per pass attempt," shrugs another. The official Sloan panel for sports betting is held near the end of the second and final day of the conference, after most of the respectable folks have moved on to dinner or hopped an early flight back—Sloan's way of letting the sharps know that they're still welcome, but that it'll be checking their pockets for silverware on the way out.
"Well, nothing was said," chuckles Rob Esteva, one of the few gambling guys wearing a suit at the conference (the other sports are rotten with them). Esteva is lingering around afterward with his London syndicate partner Dave, waiting to talk to a few of the panelists. "It's the same thing as always. No one's going to give up their secrets." This is the core issue that afflicts most gambling coverage—no one's going to talk about his methods for getting an edge when his livelihood is at stake—which in turn is why so many of the big name "sharps" you see on-air and in print are actually laughingstocks in Vegas, and among serious gamblers.
"They would be better off having a handicapping panel and just discussing general handicapping principles," another handicapper told me later. "If you're a college kid in that room, you likely want to hear how to get started and what it's really like to bet for a living and no one on that panel has ever been a pro sports bettor."
Paul Bessire, general manager of PredictionMachine.com, was in the building, but skipped the betting panel entirely this year. Instead of sitting through the hour of saber-rattling, he met with researchers and talked nuts and bolts. "I would gladly participate in the betting panel in the future," he says. "It's a total misnomer to think that we all should want to keep what we have learned about gaining an edge on the market a secret." Bessire's stance is that market inefficiencies are always closed—the edges that sharps are working with are smaller than ever—but injecting empowered, dumb money into the equation is, in essence, teaching the market to fish.
"That concept is like the poker boom of a decade ago," he says. "If the average guy thinks he has a really good chance, the pros win the biggest."
But short of the sharps taking up Bessire's point of view and bringing their "good numbers" out on stage, why bother going to Sloan at all? Can't you just come out to Boston, skip the conference, and hang out with the degenerates at the bar? The panels are all simulcast on YouTube for $30 now anyway. It turns out that a few guys did just that. But for the rest, Sloan still isn't a bad way to spend a Saturday.
"The crowd is predominantly smart people," says a guy who helps run a projection service. "Execs, analysts, but there are also the guys on TV, and the fanboy in you wants to go up and shake their hand. It's why you see everyone walking around staring at nametags." I mention having a surprise run-in with Matthew Berry. "Wait, was Matthew Berry here? Did you see him today?" Someone else chips in that they'd seen him take off earlier, and you can see the projection guy deflate for a second. "Yeah," he sighs. "There's that." But they also come for the research papers. "Every year we've taken something from the papers."

Any learning accomplished at Sloan is probably happening in the back rooms, rather literally. As you make your way through the Hynes convention center hallways, you first pass the corridor containing the main ballrooms, where the big-name guests pontificate on the big-name panels—these are reserved for the likes of Malcolm Gladwell and Phil Jackson. Further along, you've got booths lining the halls in a way that manages to suggest both a job fair and a flea market, résumé-toting eagerness and kitsch in equal measure. If you've ever made it out to Las Vegas for the annual and massive Consumer Electronics Show, the rotation-tracking basketballs and biometric RFID player-tracking systems and Bluetooth-connected, swing-correcting golf apparatuses populating the "Tech Rooms" at Sloan will look familiar, as much for the overtired executives staffing the booths as for the pervading sense of worry that their off-brand futurism is one acquisition away from being swallowed whole by one of the name-brand players. The hallways are where you hang out if you're at Sloan on a hustle. One poor sonofabitch was pitching a pick-the-losers fantasy-sports startup, walking person to person, openly offering to pay attendees simply to try it.
But past all that, past the Adidas MiCoaches and data-mining recruiters, out beyond the expandable, off-Broadway rooms where they put up cult icons like Edward Tufte and cram in the trade-show acts, down at the very end of the hallway, is room 312. This is where the presentations for the Sloan research paper competition are held in half-hour blocks. (Other panels take up a full hour). With a few exceptions, the crowds down here are thin and the talks putter along with the endearing lack of polish you'd expect from a bunch of kids who stayed up all night writing their lines. If the featured panelists give you the sense that they mainly are selling you on ESPN's ability to speak about analytics in an entertaining fashion, the people presenting actual research give the impression that they are sitting at your kitchen table selling you a good set of steak knives. They're informative and dry and interested in what you think, in a way that no one on the dais in Ballroom A has been in quite some time.
Room 312 is where you'll find guys like Daniel Cervone and Alexander D'Amour, the Ph.D. candidates in the Harvard group who presented their paper on expected value of offensive possessions in the NBA, which had generated the most hype of any new research leading into Sloan. The paper, "Pointwise: Predicting Points and Valuing Decisions in Real Time with NBA Optical Tracking Data," uses data from the motion-tracking SportVU cameras installed in 13 NBA arenas last season (this year every building is equipped with them, so it will need some updating) to generate a "stock ticker" of how many points a possession is worth based on where players and defenders are on the floor, and how good they are at scoring from there. The stat it generates is called estimated possession value, or EPV. It's the most ambitious of the papers on hand—automatically evaluating decisions could be the Rosetta Stone for figuring out how to quantify defense—and the only one that might fundamentally revolutionize the way people talk about a sport. It's also complicated as all hell. All of the research papers are available on Sloan's website weeks prior to the conference, but hearing the methods explained in language plain enough for the pack of 12-year-olds parked in the front row does help with the digestion.
That's good, because any digestion of EPV is going to have to go through Cervone and D'Amour. So far, SportVU data are only available to select research groups, like the one at Harvard, and even then they're so massive that it would be unrealistic for most moonlighting analysts to run on the hardware available to them. And so it, along with five of the other seven papers at Sloan this year, is not reproducible, which is kind of like someone finding alien life, and then never letting anyone else run tests on it. (You'll just have to take our word.) And while there is never anything so dull as an academic thumb war over data availability, this does fundamentally impact the way that these "breakthroughs" will be used. There are some basic SportVU data on NBA.com, but none that you'd really mess with much more than adjusting per minute. We're a long way from a point where stats for every player are exchanging hands on message boards, where some basketball genius can materialize from nowhere to make sense of them, and then a short time later make the metric available on Basketball-Reference.com—or even ESPN.com. Practically, the data are too large and too valuable to be available in any wide sense, and because of technical impracticalities (remember that bit about how hard it is for ESPN to get even simple soccer stats their own page?), setting up a simple page to view an updated set of the stats—like the page for John Hollinger's NBA stats on ESPN—is unlikely. These are basically boutique stats, like Kirk Goldsberry's fascinating but inert ShotScore, that turn up in a few articles by a few analysts a year, but not on a week-by-week, game-by-game basis.
Not to say that it isn't something everyone involved wants to happen. "We would love to have a site that gives fans a portal into EPV," says Cervone in an email, "allowing them to load up those annotated stock ticker graphics for any basketball play." But, he admits, "I have no idea how realistic this is given the current data situation."
D'Amour agrees. "We would love for some fan-facing organizations to have access to the data and to replicate our work," he writes in an email. "Or to manage that fan-facing outlet ourselves. We feel that our 'breakthrough' here is how we approached the modeling to answer a big basketball question. EPV doesn't just fall out of the dataset when you take a few creatively defined averages, or when you hit the data with an off-the-shelf machine learning method. To calculate EPV we have to define a whole probabilistic modeling framework around how a possession unfolds and how player decisions relate to court spacing. That modeling step is where the brilliant basketball minds on the message boards could help us, and frankly it's a much more interesting conversation than who gets to look at which databases. In a perfect world, the story here would be about our model, not about our data."
That would be a perfect setup, but for now, things will probably sort themselves out. There's a chance that the MLB's new system for tracking fielding will turn out to be something similar. Maybe we get to a point where the year-end data (17 PETAbytes for a full MLB season, a comparable shit-ton for SportVU) is hosted and torrented by the NBA and MLB. Or maybe we don't. Cervone points out that even though PITCHf/x data has been public for years, it's rarely used in its raw form because of its unwieldiness—and the current, truncated version of SportVU data is 10 times as large.
However it works out, two immediate questions are posed. The first is whether Sloan and the frontiers of data in sports are in any sense now a place for a basement enthusiast to come to hone their craft. "The main problem is that it's proprietary data," a handicapper who's been coming for years told me. "So someone like me would never have a use for it." A ticket to Sloan costs $600 (god bless those MIT business students, who, frankly, are running the best hustle of the weekend), and if the main panels have turned to mush and the research is fascinating but totally non-actionable, what incentive is there here for anyone who wants to do more than observe?
Second, if the entirety of next-level sports analytics is going to happen behind closed doors, the people in those rooms become that much more important.

"The people that record this data, do they understand basketball?"
Back at the NBA Analytics panel, Zach Lowe is attempting to tease out a complex thought that Stan Van Gundy is having trouble getting across. As he sees it, there is a fundamental problem with how analytics are used by pro teams.
"I mean, I said to you before," Van Gundy replies, "I don't trust most of it."
You'll hear a surprising amount of things like this at Sloan, and the instinct is to recoil at an older coach pushing back against a new paradigm he isn't equipped to deal with. But Van Gundy, who is a functional analytics lexicon away from being the internet's favorite basketball smart guy and the only NBA panelist besides Lowe who seems to have gotten out of bed this morning, isn't that at all.
"Look," he says, "A lot of pick-and-rolls, Brad [Stevens] will tell you, there's pick-and-rolls designed to score, and there's pick-and-rolls you're running to get into something else. If you're recording it, and you're treating those two things the same, then you don't know what you're doing. And so, to me, I think a lot of the analytics stuff can be very useful, but if you're using that in place of sitting down and watching film yourself and seeing what's going on, you're making a big mistake.
"I'm reading in a magazine that Paul George, people are scoring 41 percent of the time on him in pick-and-rolls [current figure is 32.8 FG%, 32.5 percent to score], I don't know how the hell I possibly use that information. What, I'm not going to run pick-and-rolls against him? Really, I don't know—it's a great article, but I also read he's run 130 miles over the course of the season. Of what possible use could that be?"
If that sounds entirely correct but somehow a little off to you (and it's all much funnier when you imagine it in Stan's particular tone of manic incredulity), it's because Van Gundy inadvertently bumped up against one of the bigger tensions in how analytics are covered and presented. What is useful and actionable to coaches may as well be ancient Akkadian for a casual reader. And so we entertain them with baubles, like Paul George running 130 miles this season, or no one passing the ball to Bismack Biyombo. The problem comes with stats that aren't obviously baubly—that 32.5 percent number for George, for instance—and presenting them without the proper context. George is in a pack with Greivis Vasquez, Chris Paul, and John Wall as the best defenders on pick and roll ballhandlers, as judged by points per possession and the percent of plays that they let their opponent score, but why is that? Is it because his bigs are good at shading help until he recovers? How often does his man shoot, and from where?
(These data are out there, by the way. Just 20 minutes prior to this panel, a soccer researcher named Patrick Lucey had wrapped up a presentation by explaining that the technology used for his study could also be put to action recalling specific basketball plays, not just the archetypes. So if you find a play with a high screen and roll and then a kickout to the left corner for a three, you'd be able to pull up all similar plays that ran in that pattern. But again, this is only available to a select group of researchers for the time being.)
Anyone who's ever done any worthwhile work in basketball analytics will caution that basketball is a complex, contextual sport, a series of overlapping interactions between players, not a series of discrete individual actions, like baseball. The best analysts, like Grantland's Zach Lowe, watch an enormous amount of basketball, and have access to coaches and GMs who take the time to explain what they're doing and why. They have the capacity to pepper in the little tactical details you used to get from beat writers—like, Mike Conley's signature move is a lack of a signature move—with a tacit understanding of how far the data can be taken. But for a lot of writers, or even professional analysts, this isn't always the case.
To this point, Steve Kerr steps in with an anecdote from his days with the Suns.
"I'm in Phoenix," he starts. "Amar'e Stoudemire was going to be a free agent, we had to think about trading him, so we're watching tape of all these different guys, and we're looking at J.J. Hickson. One of our stats guys says, 'J.J. Hickson shoots a better percentage from 0 to 5 feet than Amar'e Stoudemire.' I said, 'You're kidding me, right?' He says: 'No, it's right here. It's 65 percent to 62 percent.' I think, that's impossible, Amare's one of the great finishers in the history of this league. Especially with all the tough ones, all the little four-footers. So we watch J.J. Hickson, and after about 20 minutes I realized that every one of his shots from one to five feet is actually from one foot. All he can do is dunk."
That specific example probably speaks more to general incompetence of the Suns, but it's something most of us have done as we page through NBA.com's shot charts. We impart unwarranted certitude onto stats, particularly the ones branded "Advanced."
Bill James used to write about "the fog," about how the lack of evidence that a thing exists is not definitive proof that it doesn't. He was talking mostly about clutch hitting and pitching, and if you page through the classic "Underestimating the Fog" you'll find that a lot of the supposedly false idols the stats of the day were tearing down turned out to actually be true, to varying degrees. This is an especially important idea in basketball now, and will be in other sports as their scientific revolutions come around, because the methods of observation have taken such a huge step forward. Maybe you can't judge clutch shooting with a play-by-play, but we'll find something in the new data. Just one season of half the league using SportVU and we've already (further) debunked the idea that the hot hand is pure myth.
It's fitting, and perhaps a little cruel, then, that the most useful thought to come out of a marquee panel is the reminder that it's important to know what you don't know. It's a reminder to respect the fog.
I think about James's metaphor when I think about what Sloan has become, when I think about the core, seemingly obvious topics that were elided last week, the math that couldn't be shown and the observations that couldn't be made, lest their exposure limit someone's ability to make money off them. The good numbers were being hidden, and Ma's question seemed to hover over everything. Are you being cagey or are you being vague? He was talking about the fog, too, in a way. The fog at Sloan isn't the sum of what we don't know; it's the sum of what we're keeping to ourselves.
Image by Sam Woolley
Regressing is Deadspin's home for sports science, statistics, medicine, and other nerdy endeavors.
Related
Uros Medic’s 30-Second KO Puts UFC Welterweights on Notice
Sunday MLB Best Bets: Back Zack Wheeler and Shohei Ohtani

Dan Lanning Has Oregon on the Verge of Something Special
Three August Sports Events You Won’t Want to Miss
- White Sox vs. Rays Picks: Best Bets for Friday’s MLB Showdown
- WNBA Picks: Three Best Bets for Friday’s Fever, Wings and Storm Games
- Orioles vs. Tigers Bet Picks: Best Predictions for Tuesday July 28
- WNBA Picks Tuesday: Best Bets for Lynx, Fever and Aces
- Guardians vs. Reds Monday Prediction: Best Bets for the Battle of Ohio
- MLB Best Bets for Sunday's Rockies vs. Brewers, Yankees vs. Phillies
- UFC Abu Dhabi Best Bets: Top Picks for Ankalaev vs. Guskov Fight Night
