
When Do Most No-Hitters Get Broken Up?

No-hitters have hit dead ball era rates, and every other week it seems like some random pitcher is staring down a chance at a no-hitter late in a game. So Zachary Levine of did the grunt work of tracking down just how likely a no-hitter is to be broken up on any given out, and how likely you are to see a no-hitter based on when you tune in. Turns out, a no hitter's got a 50-50 shot of happening once it passes into the ninth inning.
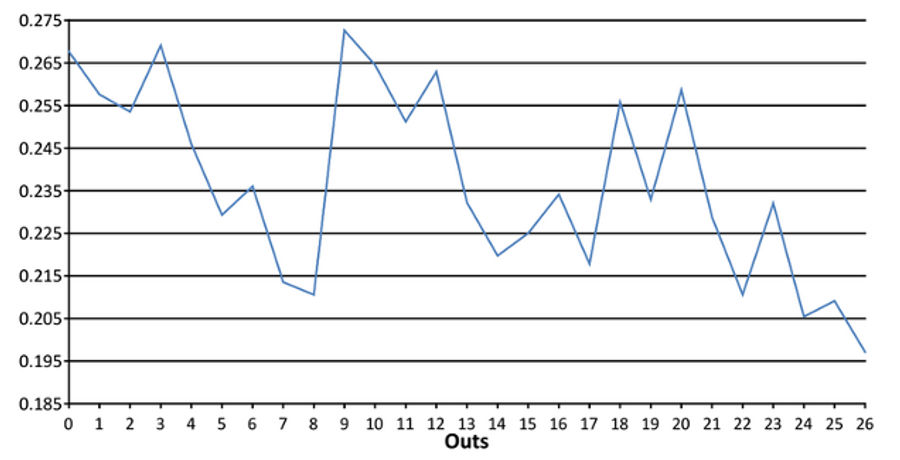
Levine examined how often no-hitters get broken up on a per-out-basis. He found the 10th out, (where pitchers are facing the top of the order the second time through) trips pitchers up most as about 27 percent of no-hitters are broken up at this point. But by the time they reach the end of the game, pitchers seem to bear down and close out the games with a much higher rate of outs, presumably helped along by facing the bottom of the order one more time. At the start of the eighth inning, the game has a 23.59 percent chance of ending in a no-hitter; at the start of the ninth, 50.45 percent.
The chart below shows how likely each out is to break up the no-hitters. You can read the full story over at Baseball Prospectus.


- Best NBA Betting Picks and Predictions for Monday April 6th
- National Championship Bet Pick: Why Michigan Has the Edge Over UConn
- UFC Vegas 115 Betting Picks: Moicano vs. Duncan Headlines April 4th Card
- NBA Betting Picks April 4th: Three Best Bets for Saturday's Slate
- Michigan vs. Arizona Bets: Wolverines Hold Edge in Final Four Showdown
- Best NBA Betting Picks Today: Friday April 3rd Expert Predictions
- MLB Pitcher Props Today: Best Baseball Bets for April 3rd
