
graphics Page 8 - Sports News, Headlines & Highlights
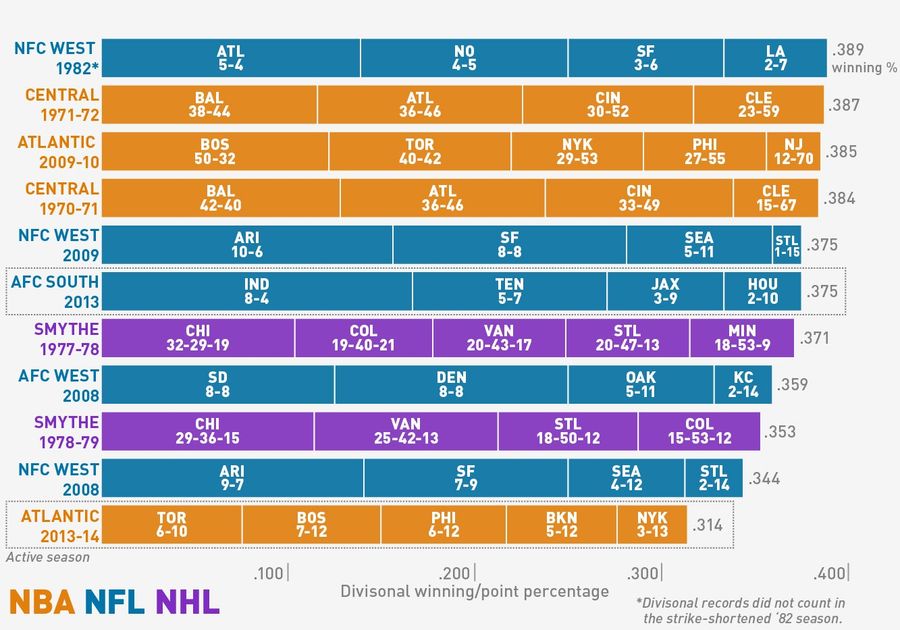
The NBA's Atlantic Division Is (So Far) The Worst Division Of All Time
The Raptors, 76ers, and Knicks lost on Sunday, which means that, through 86 games, the Atlantic Division had a winning percentage of .314. You can't blame Philadelphia, whose 6-12 record has put them on track to crush its preseason over/under of 16.5 wins. Boston and Toronto were expected to be medi...
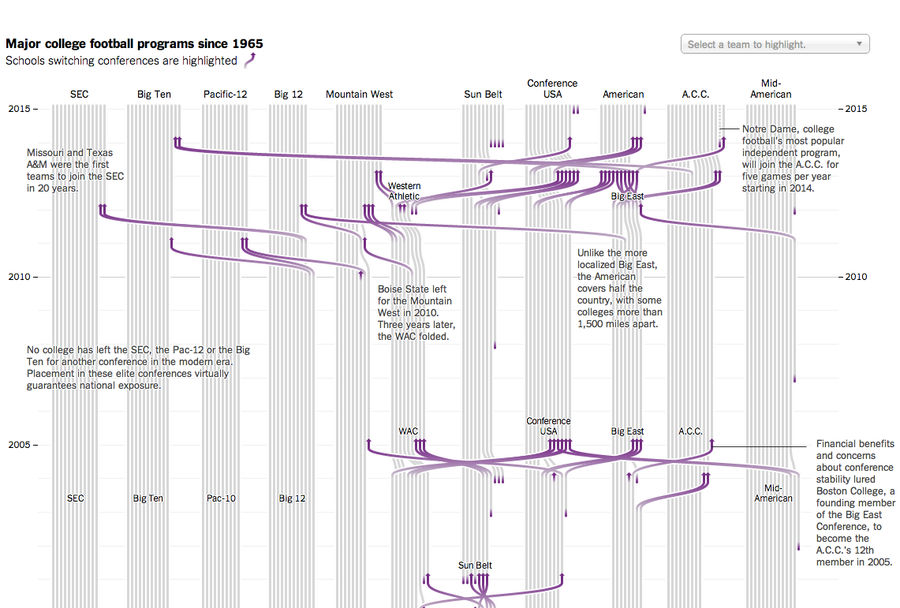
50 Years Of NCAA Football Realignment, Visualized
This Saturday's SEC championship game comes freighted with the awkwardness of college football realignment. Missouri, representing the "SEC East," will take on Auburn, representing the "SEC West," even though the latter lies a couple hundred miles closer to the Atlantic Ocean. Wacky!...
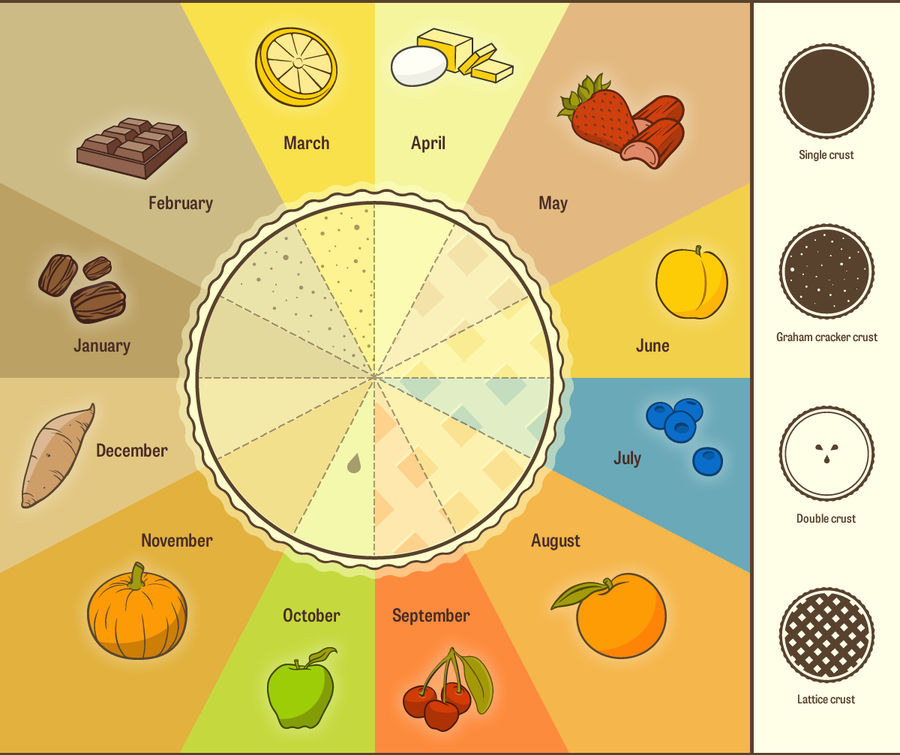
Pie Chart: A Seasonal Pie For Every Month (On A Chart)
It's been floating around for a few weeks, but Molly Birnbaum of Modern Farmer has compiled an excellent pie chart (illustrated by Omar Lee) that details which seasonal pies you should be preparing and eating each month, as well as the style of crust you should use to maximize the tastiness of said ...
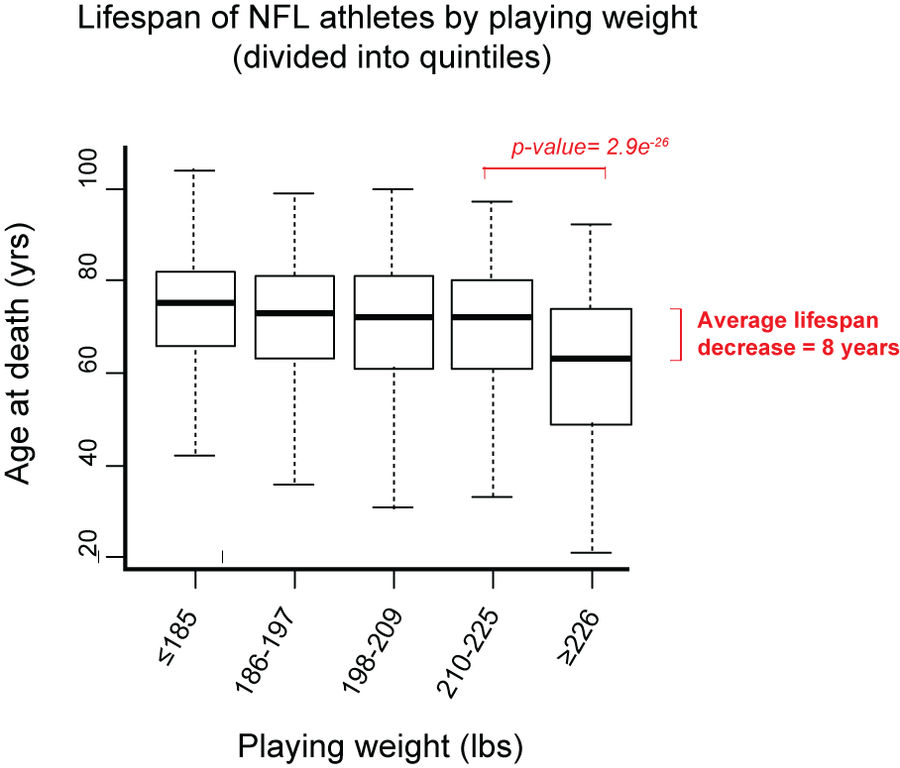
Chart: How Does Weight Affect The Lifespans Of Pro Football Players?
Over on the Reddit sub r/dataisbeautiful, users have been playing around with an interesting dataset (pulled from Pro Football Reference) that looks at the lifespan of pro players from the late 19th-century to present. The chart above, by user "zipcitytrucker" breaks down the age of death by playing...
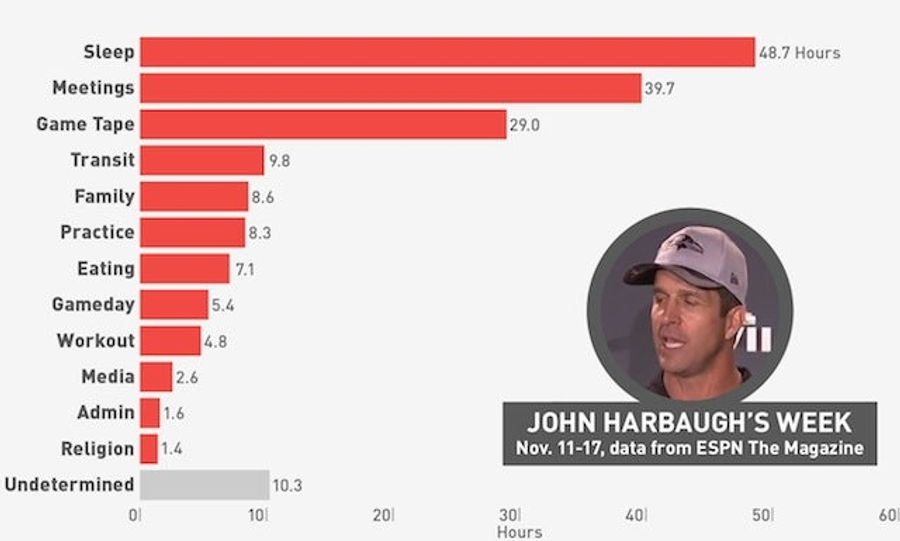
Chart: A Week In The Insane Life Of An NFL Head Coach
Over on ESPN, Ravens head coach John Harbaugh was kind enough to provide a schedule of his work week leading up to Baltimore's game at Chicago on Nov. 17 (the story will appear in the Dec. 9 edition of ESPN The Magazine). It's not an easy job—Harbaugh spends about 69 hours a week in meetings (or mee...
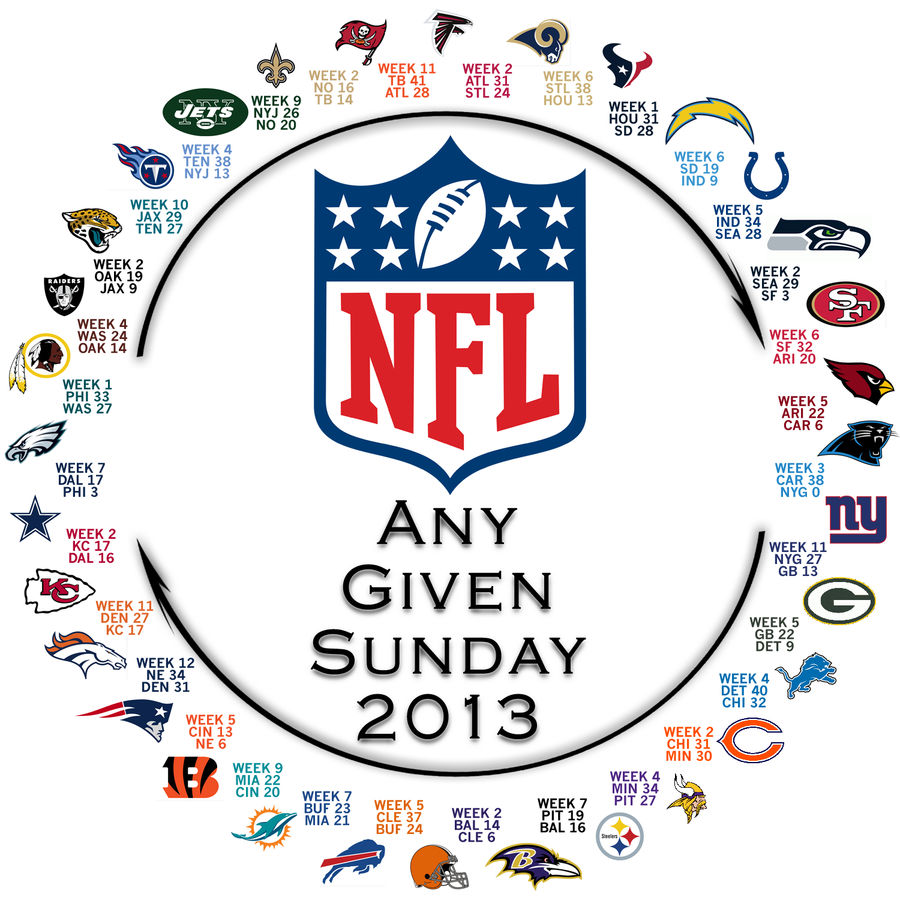
Behold! The NFL's Circle Of Parity
It took 12 weeks, but we've reached that point in the season. It's now possible to visualize the NFL's circle of life, where every team has lost to the team preceding it. Any Given Sunday, indeed....
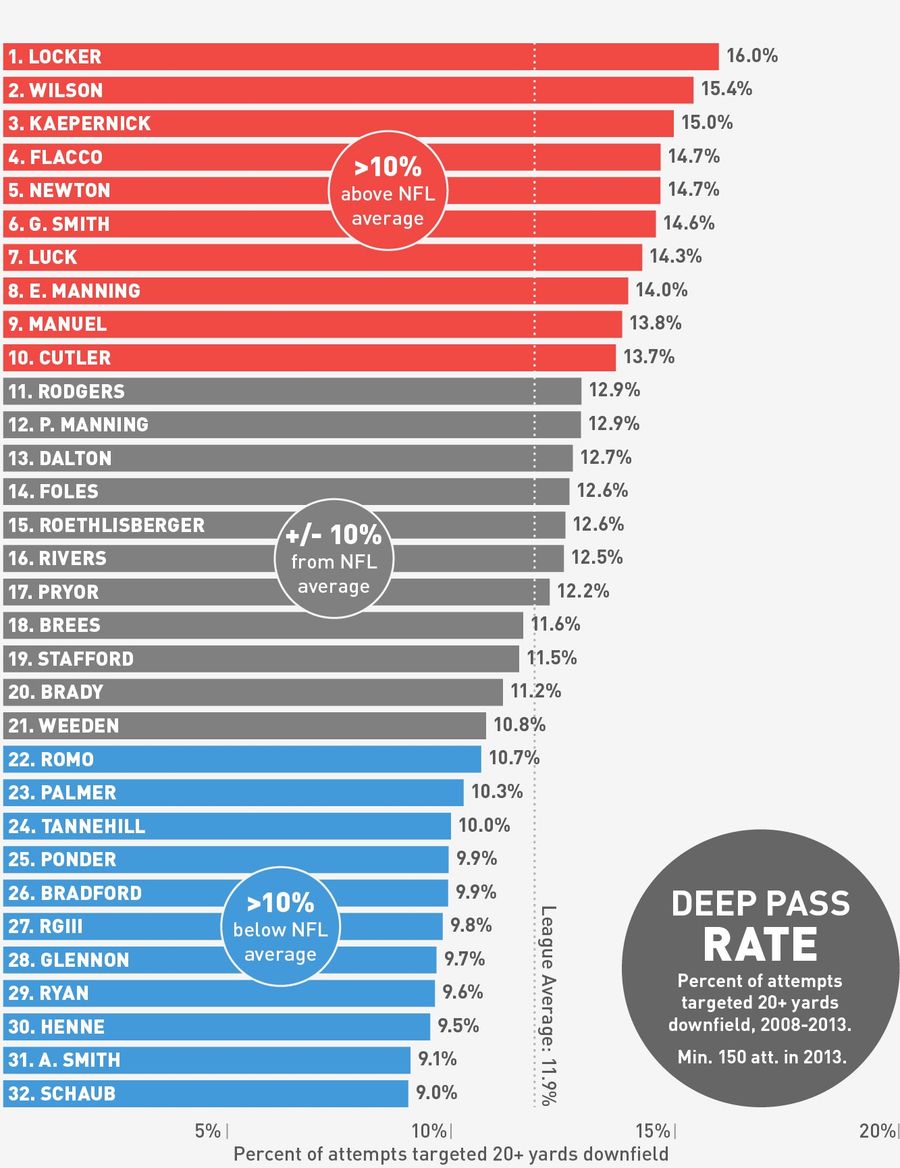
Charts: Who Are The Best Deep Passers In The NFL?
Deep passes are the most exciting play in televised football—the viewing audience can't see the situation downfield until the ball (and the camera) make it down there, so the play always feels, in that tiny moment before we catch up, like a sure touchdown or interception. It's well known that not ev...
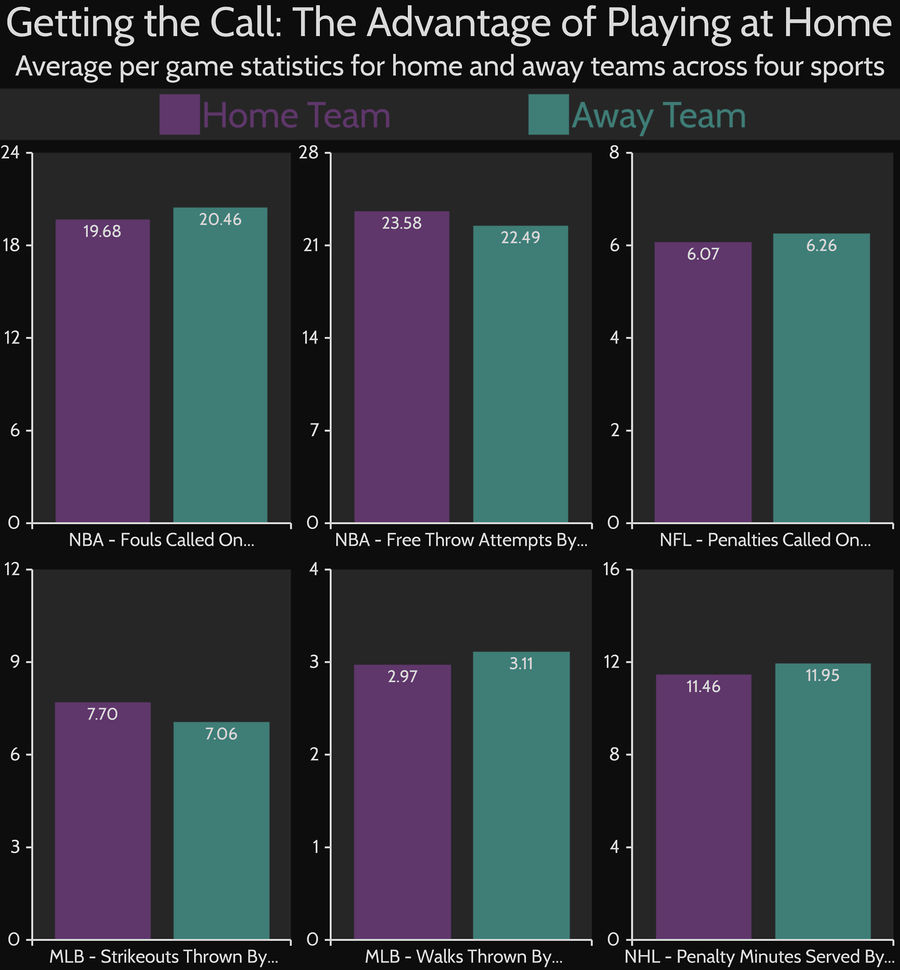
Chart: The Impact Of Home Field Advantage On Officiating, By Sport
It's a familiar complaint: Your team goes on the road for a big game, and gets totally jobbed by the refs. But do away teams really get fewer calls?...
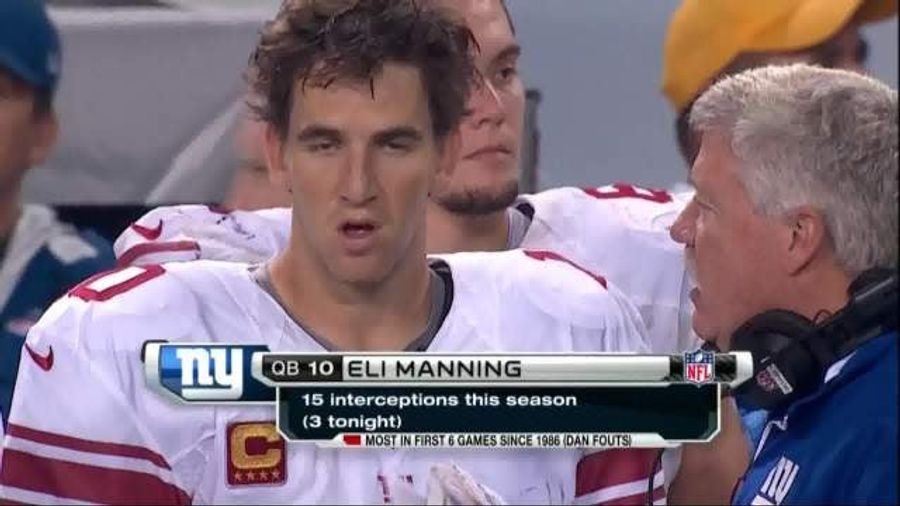
Is Eli Manning On Pace To Top The Post-Merger Interception Record?
Over on r/nfl, Reddit user marvin02 put together the graph below, showing how Peyton Manning's TD pace through 10 games compares to the five highest single-season touchdown marks in NFL history:...
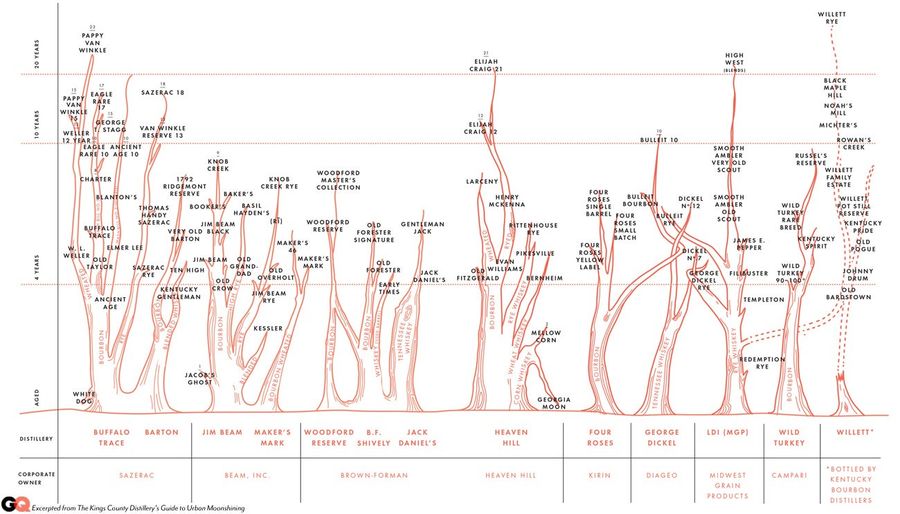
Chart: A "Family Tree" Of American Whiskeys and Bourbons
You're probably aware that most popular beers come from just a few massive parent companies, but do you know who's making that delicious bourbon you're into? The chart above—an excerpt from Colin Spoelman and David Haskell's new book The Kings County Distillery Guide to Urban Moonshining that they p...

The History Of The WWF, In One Beautifully Obsessive Poster
Graphic designer Scott Modrzynski spent over two years creating a cubist, minimalist chart of the history of the World Wrestling Federation, a portion of which you see above. RIP Doink the Clown. ...
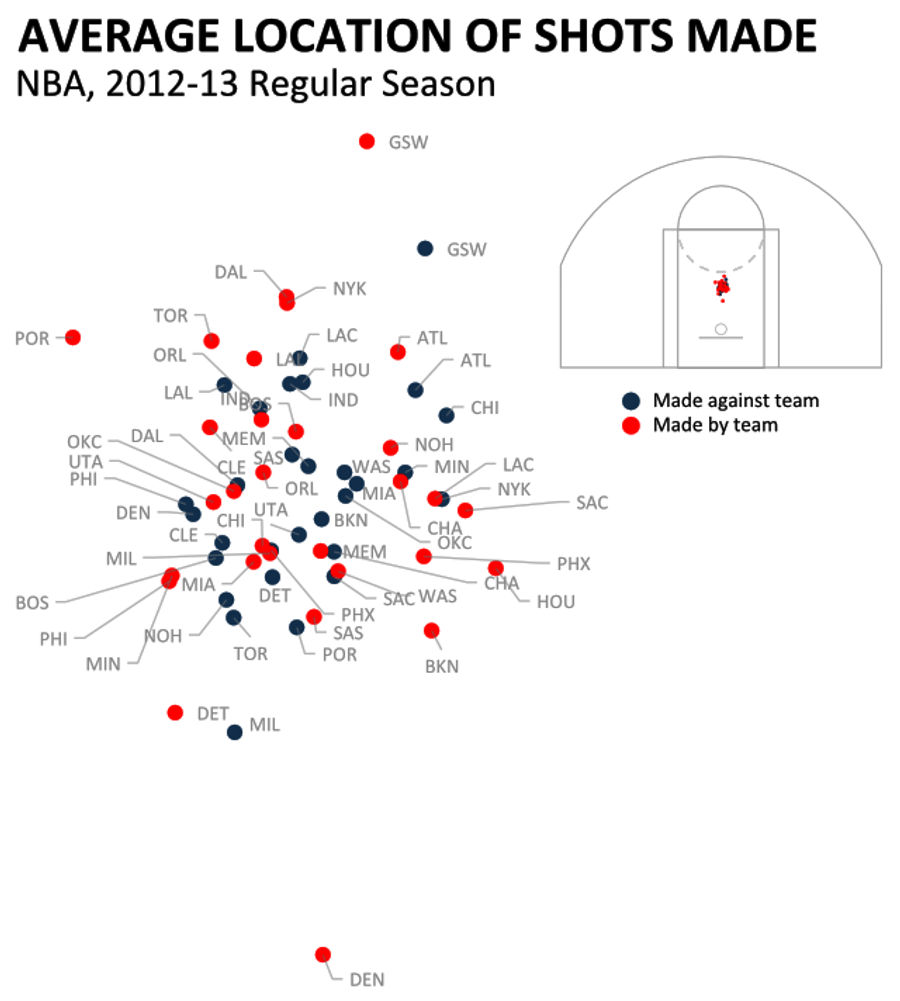
Where's Your Team Scoring From? An Early Look At NBA Distance Shooting
Although we're just a few games into the season, the shooting strategies of different squads have started to come into focus. A lot of teams—like the Warriors—continue to put more and more emphasis on three-point shots, while other teams—like the Rockets—have made a push towards getting more looks i...
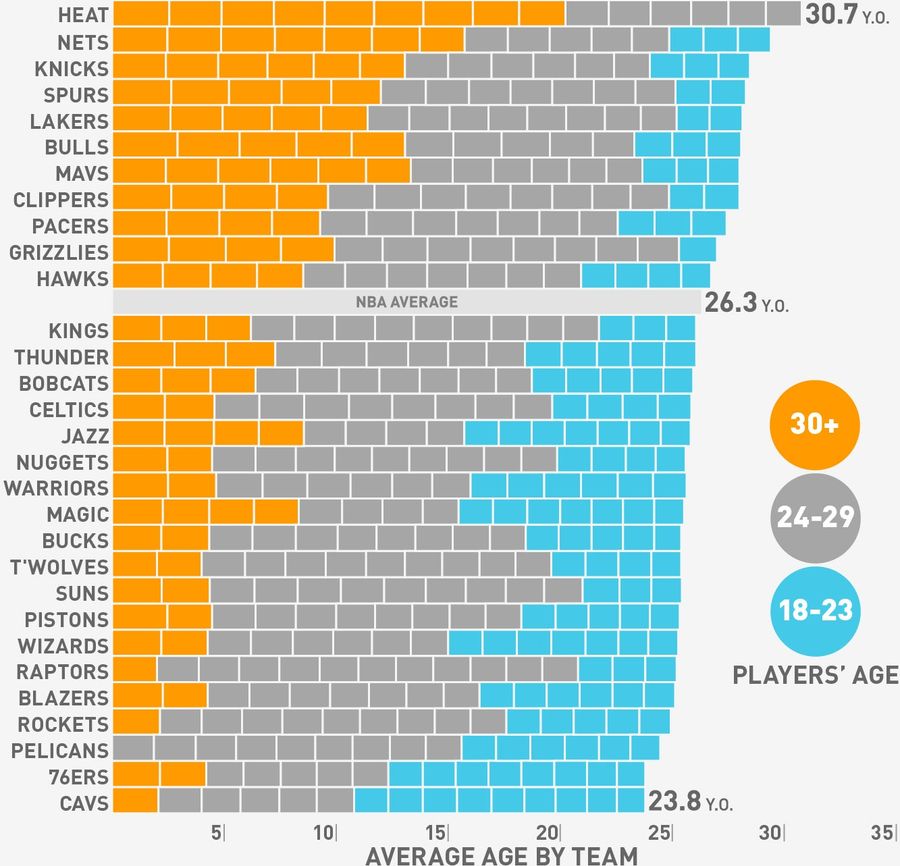
Charts: Who Are The Oldest And Fattest Teams In The NBA?
Note: The charts and text have been updated to include Roger Mason Jr. (Heat), Mike Harris (Jazz), and Brandon Davies (76ers), who were initially missing. These updates are reflected in the BestTicketBlog's charts as well....
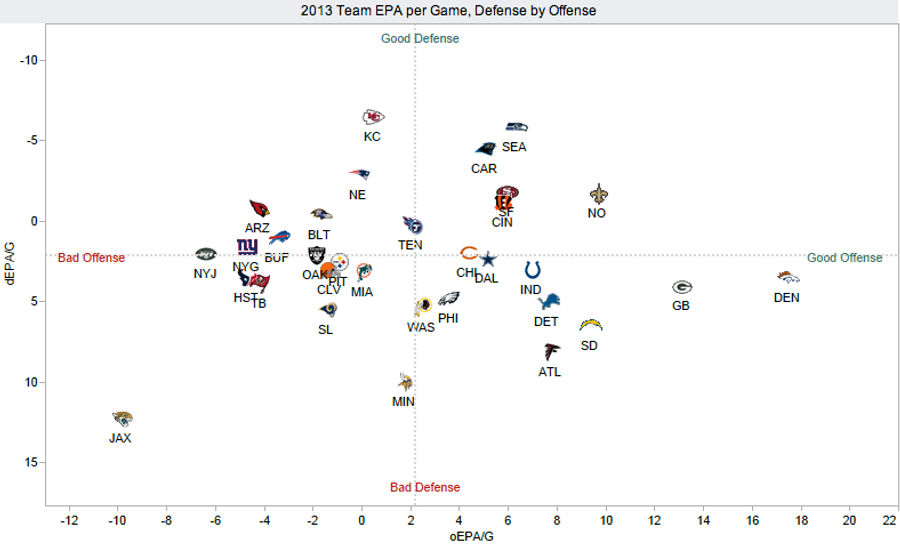
Midway Point: How Does Your NFL Team Stack Up On Offense and Defense?
After Week 5, we took a look at the excellent offensive/defensive visualizations that Brian Burke puts together on AdvancedNFLstats.com. A lot of weird shit can happen in the first five weeks of the season, so now that we're at the midway point, it's worth taking another look to see how teams have s...
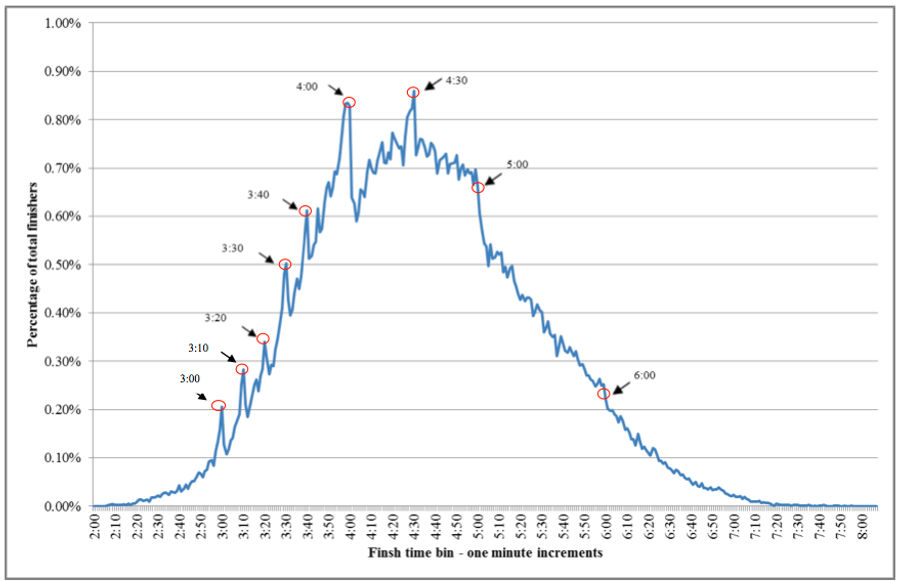
Why Marathoners (Especially Men) Are "Irrational" Runners
If you're going to sacrifice your body to run 26.2 miles all at once, shouldn't you at least run them as best you can? Eric Allen (USC) and Patricia Dechow (Berkeley) took a look at finishing times for 300,000 Chicago Marathon runners from 2003 to 2011, concluding, in the style of all behavioral eco...
Infographics: Where Does Your NFL Team's Offense Come From?
The NFL season is just about half over, which means most teams are what they're going to be. But what does that look like, exactly? Here's a quick visual guide for every NFL team's offense....
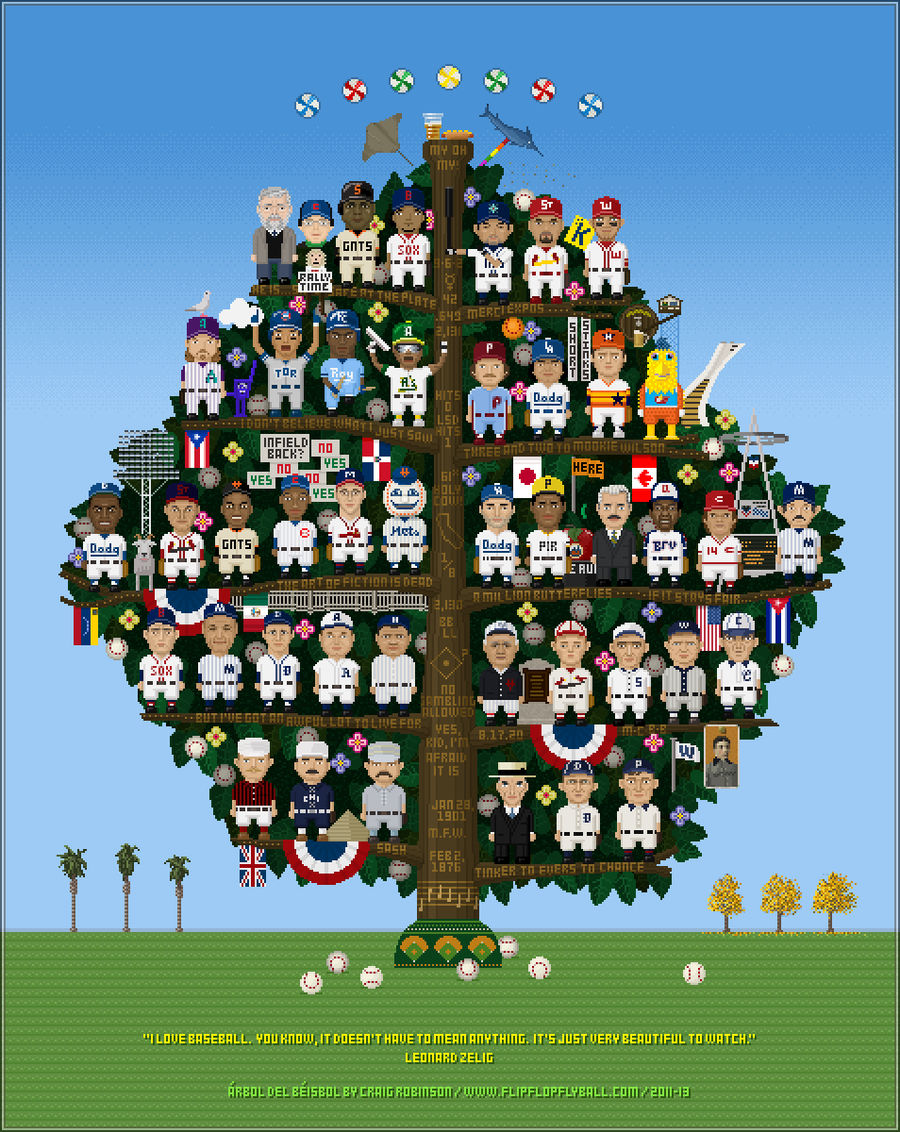
The History Of Baseball, In One Weird, Beautiful Drawing
The drawing above, Árbol de Béisbol, is by Craig Robinson of FlipFlopFlyin.com—you can check out a larger version on his site. Craig was kind enough to let us post his explanatory notes on the players, artifacts, quotes, and references featured in the graphic; you can find them in the image annotati...
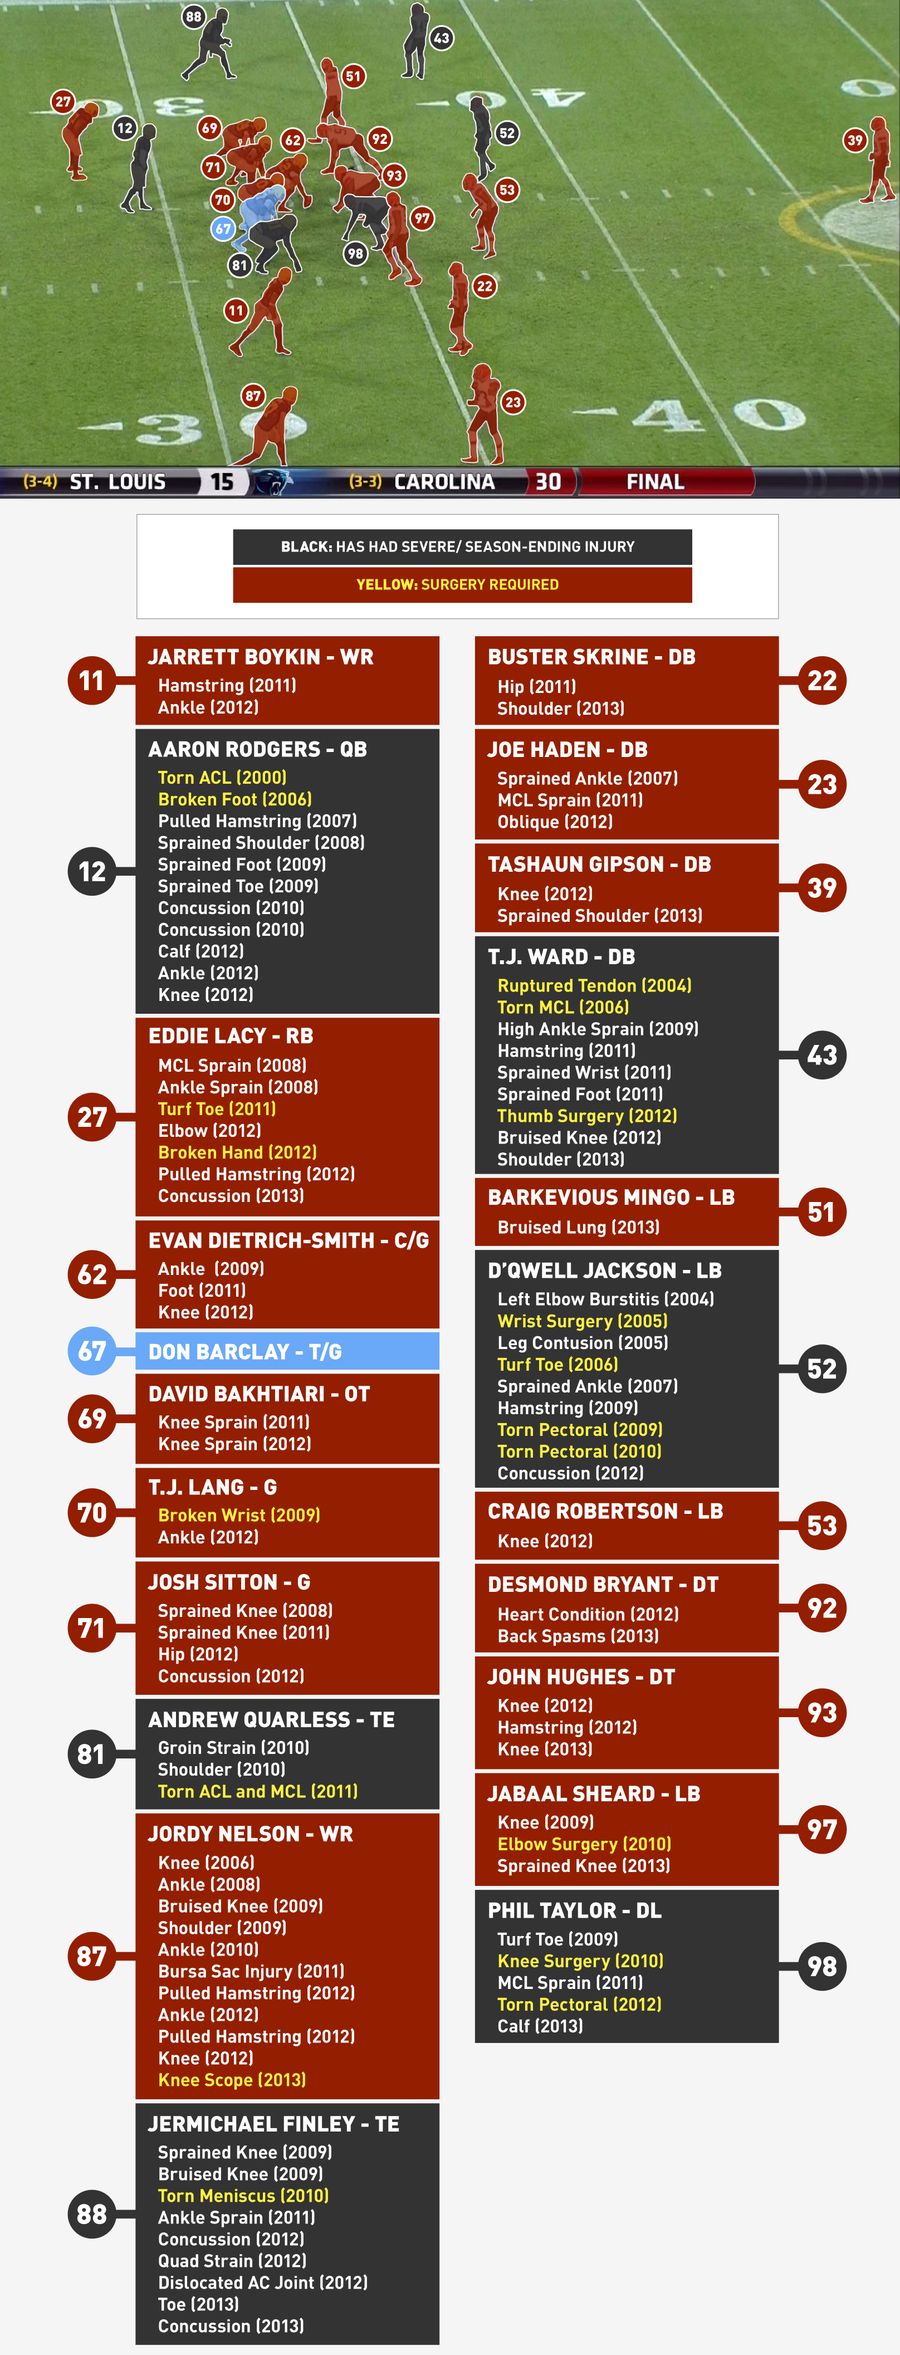
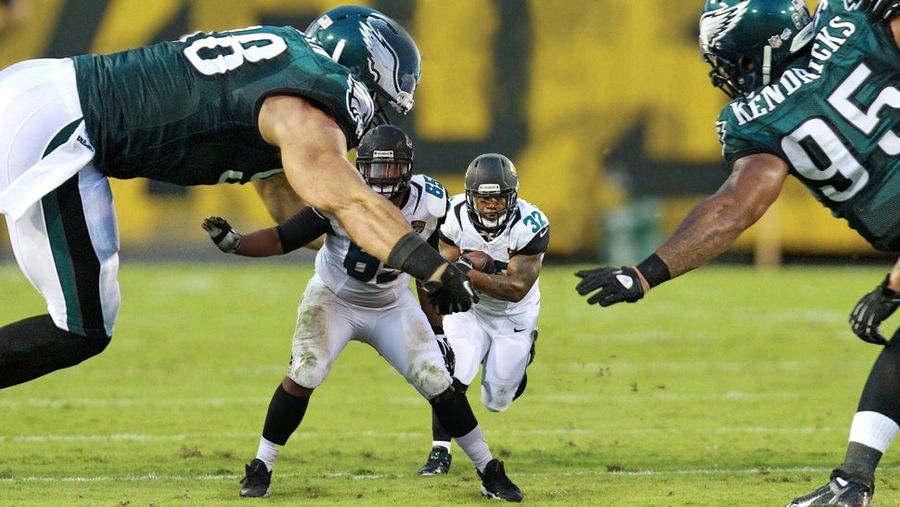
Injury History Of Everyone On The Field When Jermichael Finley Got Hurt
The play above, from the fourth quarter of last weekend's Browns-Packers game, ended with Jermichael Finley temporarily paralyzed on the field after a major hit. He was carted off, began walking the next day, and was released from the hospital on Thursday after being diagnosed with a spinal contusio...
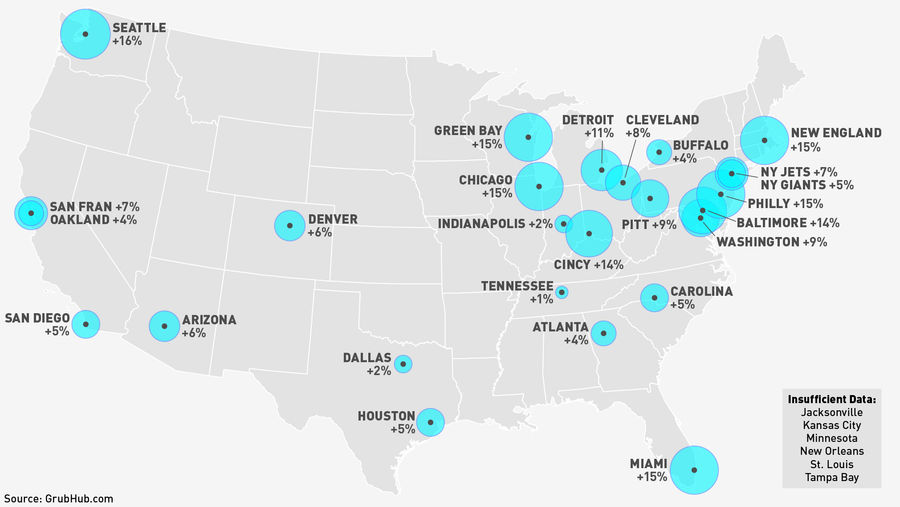
Which Lazy-Ass NFL Fans Order The Most Food Online During Games?
Watching Sunday football is already sweetly lazy, but to take the laziness to the next level you really have to order greasy delivery, and you have to order it online....
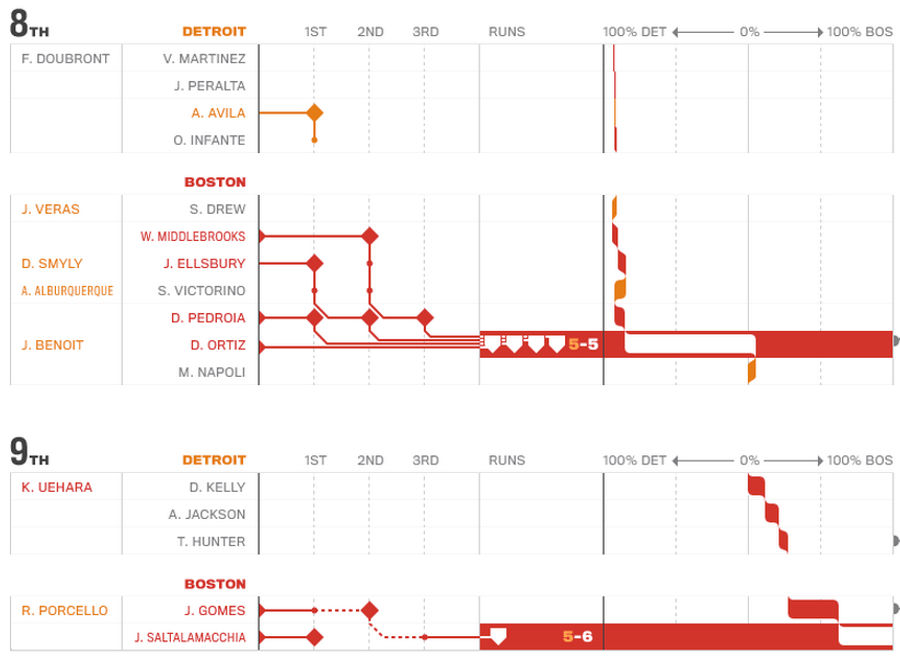
Check Out These Beautiful (And Useful) Graphic MLB "Box Scores"
Michael Deal, who previously gave us this infographic of every pitch of the All-Star game as part of his Statlas project, has developed a new take on the MLB box score. The sample above shows the 8th and 9th inning of Game 2 of the ALCS, which, as Deal's line-and-node representations make clear, wer...