
Which NBA Coaches Are Best At Designing Plays During Timeouts?

There is something impossibly satisfying about watching a team come out of a timeout and run an ornately designed play that springs someone for a wide-open look or an easy layup. A gorgeous play there, a nonsense turnover here, the very best reputations might be well won over years, but overall, our sense of which coaches and teams are best in these situations is largely anecdotal. Here's our attempt at fixing that.
How This Works
Stephanie Brown and Jordan Sheldon of Bloomberg Sports ran the timeout numbers for us (data gathered current as of Dec. 11), and we have at least the beginnings of an answer. To isolate dead ball performance, BS only looked at plays immediately following a timeout (including officials' timeouts—though not ones that came just before free throws—and totaled up the points per possession for them, as well as the true shooting percentage for those possessions. This loses plays following intentional fouls late in a game, out of bounds, and other times you might get a set play, but it allows us to isolate the times you'll definitely see a designed set play.
But because we're trying to isolate how much of an effect these plays have on a team in relation to its performance in open play, we can't just look at who has the best efficiency and percentage (though that's still useful). We decided to try to look at how offenses perform in just the halfcourt instead of their overall offense, because it's not like you can start a fast break off of a timeout. So we used Synergy Sports's data for points per possession overall and transition offense, and came up with a number for non-transition offensive efficiency per 100 possessions. Then, we subtracted that from the efficiency after a timeout, which gave us the stat you see here, which we're giving the bullshit name of Timeout Play Rating, just to have something to call it.
Here's how that looks in practice. Out of timeouts, the Mavericks score 96.7 points per 100 possessions (8.05 points better than the league of 88.65). In regular halfcourt, they're at 91.2. So their score for Timeout Play Efficiency is +5.48. The same goes for defense. Brooklyn is last in the league, allowing opponents to score 88.7 points per 100 in the halfcourt. But by improving to 84.8 after timeouts, it rates an actually solid -3.9, which is good for sixth in the league.
We should also point out that since this comprises all timeouts taken throughout the course of a game, the stats include those taken at the ends of quarters where the only reasonable outcome is a low percentage shot. This includes all manner of necessarily awful shots—shots with less than a second on the clock, shots with the subs in and no chance in hell the coach is running out a shooter for one play at the end of the second quarter, etc. Also, if a team is regularly winning by blowout (like the Spurs), it's possible that the performance out of timeouts will suffer, though we'd need more data to say that confidently.
You can find the full table of results at the bottom of the post. For now, here are some breakdowns of what happens on offense and defense. The charts below show a team's half-court offensive or defensive efficiency, with an arrow pointing to their post-TO offensive or defensive efficiency. This means that the length of the arrow is equivalent to "Timeout Play Efficiency."
On Offense
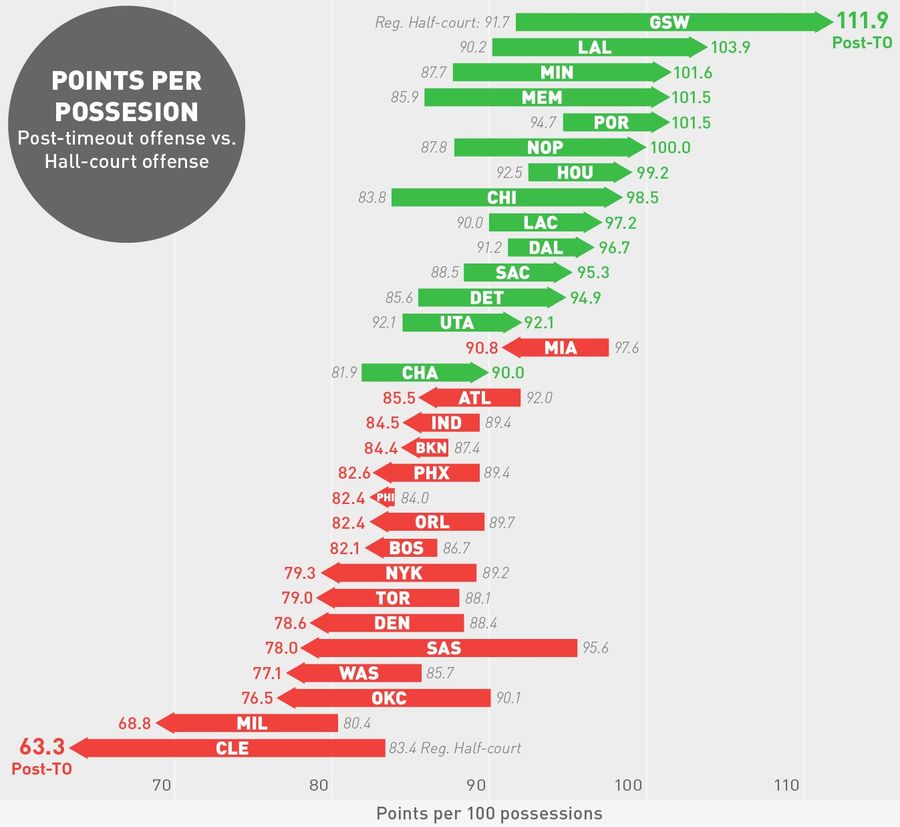
League-wide, there's a slight offensive benefit to calling a timeout, but only a slight one. Halfcourt plays score 88.44 points per 100 possessions, while post-timeout plays score 88.65.
Starting at the top, Mark Jackson's Golden State is preposterously efficient out of timeout situations, well ahead of every other team. (It's also fourth by True Shooting percentage adjustment.) Golden State runs a lot of novel actions on its set plays to spring Steph and Klay for shots, like the universally loved Elevator Doors play, or the Split Action play that sends two players smashing into each other and then away, to open space. Most often these happen in open play, but they're also used out of dead balls to good effect. Having bigs like David Lee and Bogut, as well as the addition of a spatially savvy player like Andre Iguodala, makes the Dubs just a sublime team to watch. And of course, having Steph lets you do things no one else really can.
At the bottom, you have teams like Cleveland, Oklahoma City, and perplexingly, the Spurs. You'd guess that Mike Brown and Scotty Brooks would end up on this list—your eyes don't lie to you that badly—but Pop? Greg Popovich's team is known for its dizzying ball movement and gorgeous set plays, so what gives? Part of it could be that not every team is going to use its timeouts the same. San Antonio has the second best halfcourt offense, behind Miami, is 19-4, and has the highest point differential in the league, so a lot of its timeouts may be being used to insert the bench, or run by a bench unit that's far inferior to the starters. So that could go some way to explaining away the 17.64 dropoff—but it's still surprising.
Meanwhile, fellow savant-by-reputation Rick Carlisle is in the middle of the pack here, improving his team by 5.48 points per 100 on these plays. A curious thing here is I'm not totally sure how Synergy handles the semi-transition opportunities that Monta creates, so those might be shading the data a bit if they're counted as halfcourt plays.
The biggest climber in the rankings is Chicago and Tom Thibodeau. The Bulls are ranked 27th in the league with a miserable 83.8 points per 100 possessions in the halfcourt, but somehow scores 98.5 out of timeout. This is not surprising. Thibs is known as a fantastic play caller. There was one play in last year's playoff series with that Nets that used a weak side double screen for Marco Belinelli to Jedi mind trick the defense into abandoning Jimmy Butler on the strong side that is one of the prettiest plays I've ever seen in person.
Right behind them is Memphis and coach David Joerger. Memphis is just 22nd in halfcourt offense—and that 85.9 points per 100 possessions figure is a big reason why the Grizz are a disappointment this year—but improves by 15.6 points out of timeouts.
On Defense
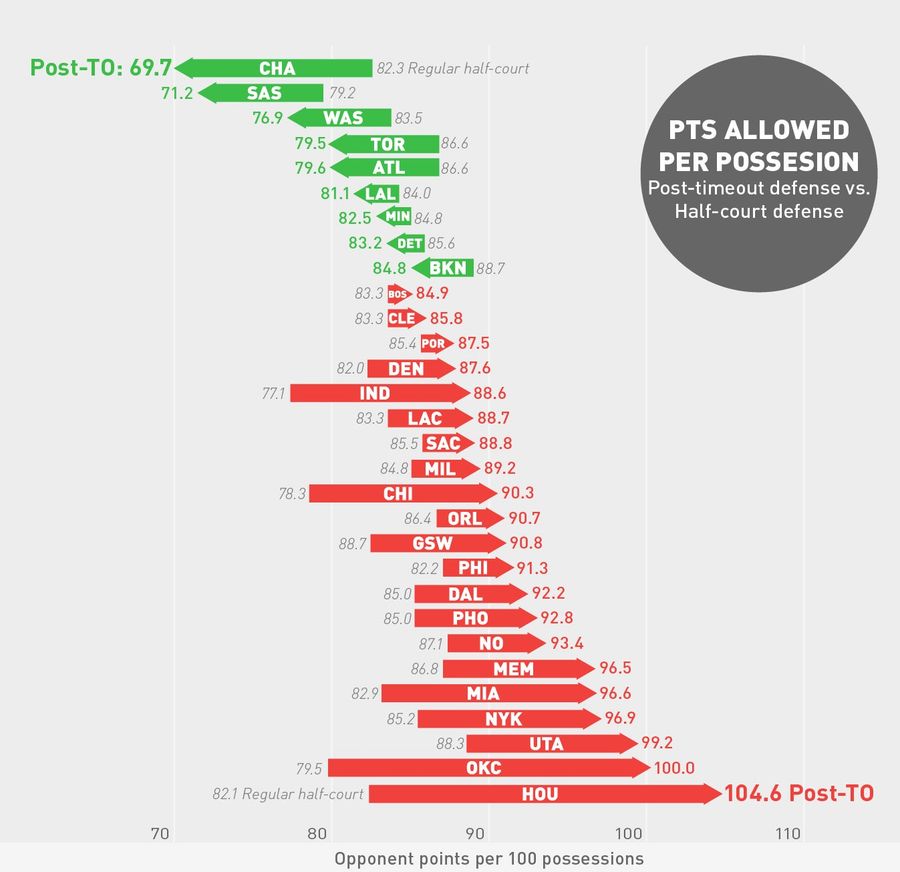
On the defensive end, you'll see a few shifts. For one, Frank Vogel's Pacers and Thibs's Bulls both take nosedives after timeouts. They go from the number one and two defenses in the halfcourt at 77.1 and 78.3 points per 100 possessions, respectively, to 88.6 and 90.3. Their defensive timeout play ratings are good for 27th and 25th in the league. We can't quite explain the lack of symmetry with the offensive chart, but if you look at overall efficiency instead of half-court efficiency the asymmetry persists, with timeouts showing a large negative effect for offenses and comparatively small positive effect for defenses.
The Spurs, meanwhile, are already the third best halfcourt team at 79.2 points per 100 possessions, but improve to an even crazier 71.2. They're topped by Charlotte, coach Steve Clifford, and our old friend Bismack Biyombo, which drops a league-high 12.6 points to allow 69.7 points per 100 on these possessions.
The real notables are at the very bottom, though. Oklahoma City (nice to see you again, Scotty) and Houston are massive, massive outliers here. OKC gives up 20.5 more points per 100 possessions, and Houston 22.5. Just how in the sweet hell? This is preposterous. It is unthinkable. The next closest, Miami at 13.7, is miles and miles in the rear-view mirror. It is still early in the season, and all three teams down here have the excuse of being good teams with relatively wide scoring margins, but 20+ points of efficiency rating remains absurd no matter how you slice it.
We also feel compelled to mention that the Lakers and Mike D'Antoni are near the top of the pack on both sides of the ball, fifth on offense and seventh on defense. They are also responsible for the best inbounds play of the past few years (and a few other great ones on top). Mike's taken a lot of (totally deserved) crap over the past few years, but this year's Lakers remain a pleasant surprise.
Mike Woodson's Knicks rank just 26th on both offense and defense.
Other Stuff
We've got a few notes about the data we're using here. First, the data we're using from Synergy was collected manually, and ended up a decimal place short on standard efficiency ratings, so the numbers as a whole came up slightly short of where they otherwise would be. We couldn't adjust for this, so there's a small bit of error inserted into them. More broadly, we aren't sure why the defensive ratings are so despicable compared to the offensive ones.
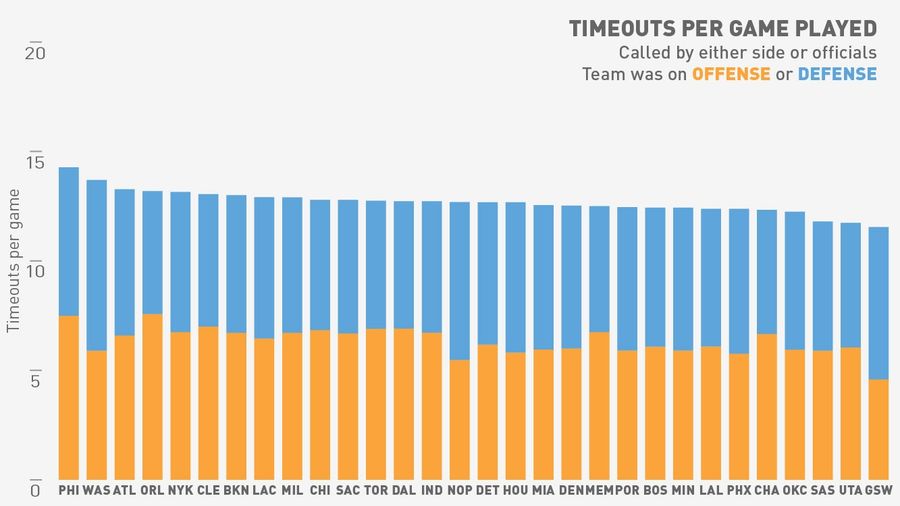
We also have numbers for average number of these timeout situations per game, which you can see in the chart below. These seem a little more random, especially this early in the season, so we didn't dwell on them as much. We know they're important to the net effect, though, so we're keeping an eye on what they do from here.
| Team | Offensive TOPR | Team | Defensive TOPR |
|---|---|---|---|
| GSW | 20.2 | CHA | -12.6 |
| MEM | 15.6 | SA | -8 |
| CHI | 14.7 | TOR | -7.1 |
| MIN | 13.9 | ATL | -7 |
| LAL | 13.7 | WAS | -6.6 |
| NO | 12.2 | BRK | -3.9 |
| DET | 9.3 | LAL | -2.9 |
| CHA | 8.1 | DET | -2.4 |
| UTH | 7.6 | MIN | -2.3 |
| LAC | 7.2 | BOS | 1.6 |
| POR | 6.8 | POR | 2.1 |
| SAC | 6.8 | CLE | 2.5 |
| HOU | 6.7 | SAC | 3.3 |
| DAL | 5.5 | ORL | 4.3 |
| PHI | -1.6 | MIL | 4.4 |
| BRK | -3 | PHI | 4.5 |
| BOS | -4.6 | LAC | 5.4 |
| IND | -4.9 | DEN | 5.6 |
| ATL | -6.5 | NO | 6.3 |
| MIA | -6.8 | DAL | 7.2 |
| PHO | -6.8 | PHO | 7.8 |
| ORL | -7.3 | GSW | 8.6 |
| WAS | -8.6 | MEM | 9.7 |
| TOR | -9.1 | UTH | 10.9 |
| DEN | -9.8 | IND | 11.5 |
| NYK | -9.9 | NYK | 11.7 |
| MIL | -11.6 | CHI | 12 |
| OKC | -13.6 | MIA | 13.7 |
| SA | -17.6 | OKC | 20.5 |
| CLE | -20.1 | HOU | 22.5 |
Top image by Jim Cooke / Charts by Reuben Fischer-Baum
StatsInsights.com is the leading source for analytical insights and data derived content spanning the NFL, MLB, NHL, NBA, Golf, Football (Soccer), NCAA, Racing, Tennis, Cricket, and more. You can find them on Twitter @BSports.

Related
The SEC Dynasty Is Over and the Big Ten Proved It
MLB Betting Picks for Wednesday: Two Totals for May 27 Slate
- Knicks vs Cavaliers Picks Today: Best Bets for Game 4 of the ECF
- Best MLB Bets Today: Top Picks for May 24 Featuring Shohei Ohtani and Ketel Marte
- Thunder vs. Spurs Game 4 Picks: Best Bets for WCF Sunday
- Three MLB Futures Worth Betting Before the Odds Disappear
- MLB Best Bets Today: Guardians Value Play and White Sox-Giants Total
- MLB Best Bets Today: Blue Jays, Diamondbacks and Athletics Picks for Thursday
- MLB Pitcher Props Today: Best Bets for Cam Schlittler, Aaron Nola and More
