
You Guys, It's A Pythagorean World Series This Year!

The Red Sox and Cardinals led the AL and NL in run differential this season, and now they're in the World Series. This is very far from breaking news, but still, it's the first time that's happened since 2007. To celebrate (kind of), Stats in the Wild put together a few fun bubble charts showing the run differentials of every World Series since 1990.
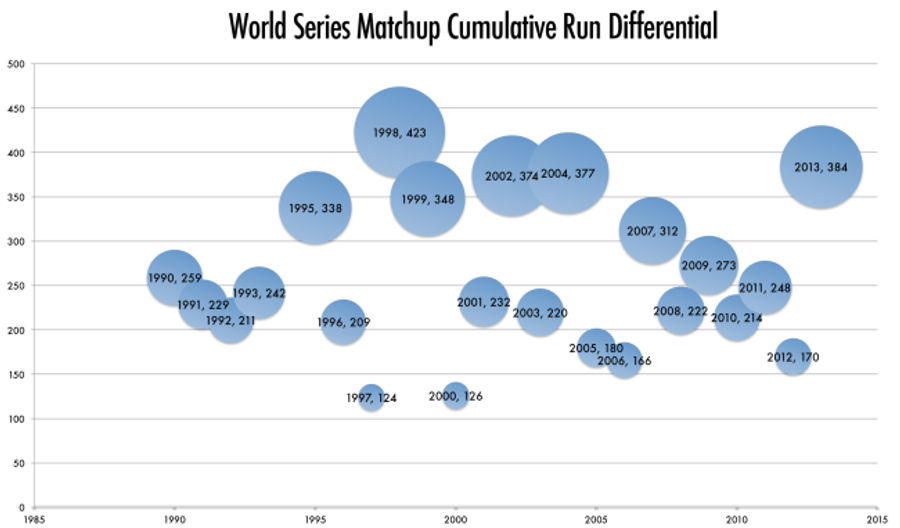
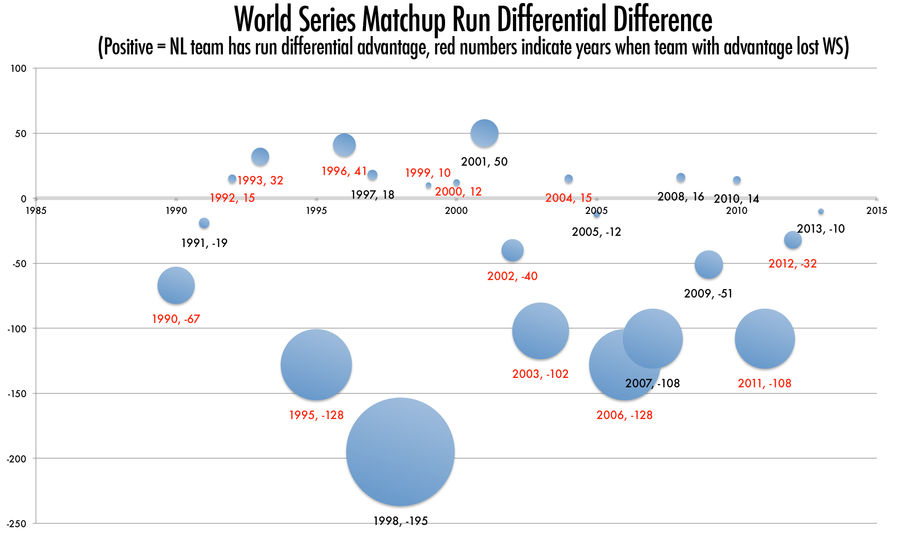
The chart above shows the gross run differential, added up between the two teams in the series. 1997 (Indians vs. Marlins) and 2000 (Yankees vs. Mets) featured teams with double-digit differentials, and year with the highest total, 1998, had that monster Yankee team up against the so-so Padres. That makes it, kind of astoundingly, both the highest combined total and the largest difference between World Series teams.
Check out the rest of the analysis over in the full post.
Related


- Best NBA Betting Picks and Predictions for Monday April 6th
- National Championship Bet Pick: Why Michigan Has the Edge Over UConn
- UFC Vegas 115 Betting Picks: Moicano vs. Duncan Headlines April 4th Card
- NBA Betting Picks April 4th: Three Best Bets for Saturday's Slate
- Michigan vs. Arizona Bets: Wolverines Hold Edge in Final Four Showdown
- Best NBA Betting Picks Today: Friday April 3rd Expert Predictions
- MLB Pitcher Props Today: Best Baseball Bets for April 3rd
