
You Guys, It's A Pythagorean World Series This Year!

The Red Sox and Cardinals led the AL and NL in run differential this season, and now they're in the World Series. This is very far from breaking news, but still, it's the first time that's happened since 2007. To celebrate (kind of), Stats in the Wild put together a few fun bubble charts showing the run differentials of every World Series since 1990.
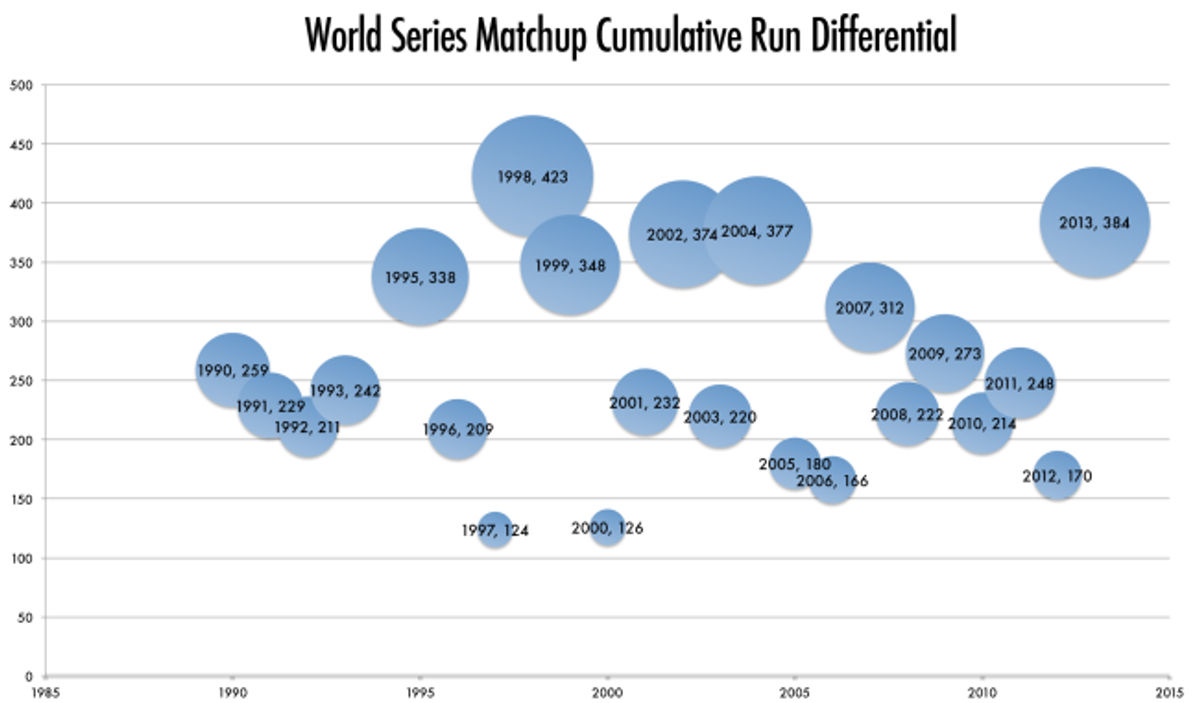
The chart above shows the gross run differential, added up between the two teams in the series. 1997 (Indians vs. Marlins) and 2000 (Yankees vs. Mets) featured teams with double-digit differentials, and year with the highest total, 1998, had that monster Yankee team up against the so-so Padres. That makes it, kind of astoundingly, both the highest combined total and the largest difference between World Series teams.
Check out the rest of the analysis over in the full post.
Related


What Prediction Markets Are Telling Us About NFL 2026 MVP

The Sacramento Kings Need to Blow It Up Before It's Too Late


Ben Askren Didn't Win the Match—But He Won the Weekend

- UFC Fight Night Best Betting Picks for Du Plessis vs. Usman in OKC
- France vs. England Best Bets: Three Picks for the World Cup Third-Place Match
- Dodgers vs. Yankees Friday July 17 Best Betting Picks and Props
- July 17 White Sox vs. Blue Jays Prediction, Odds and Best Bets
- Three MLB Futures Bets to Make After the All-Star Break
- Three Heisman Trophy Sleepers Worth Betting Before the 2026 Season
- England vs. Argentina Best Bets: Three Picks for the World Cup Semifinal
