
graphics Page 9 - Sports News, Headlines & Highlights

This Is How America Feels About Kim Kardashian And Kanye West
h/t IronMikeGallego...
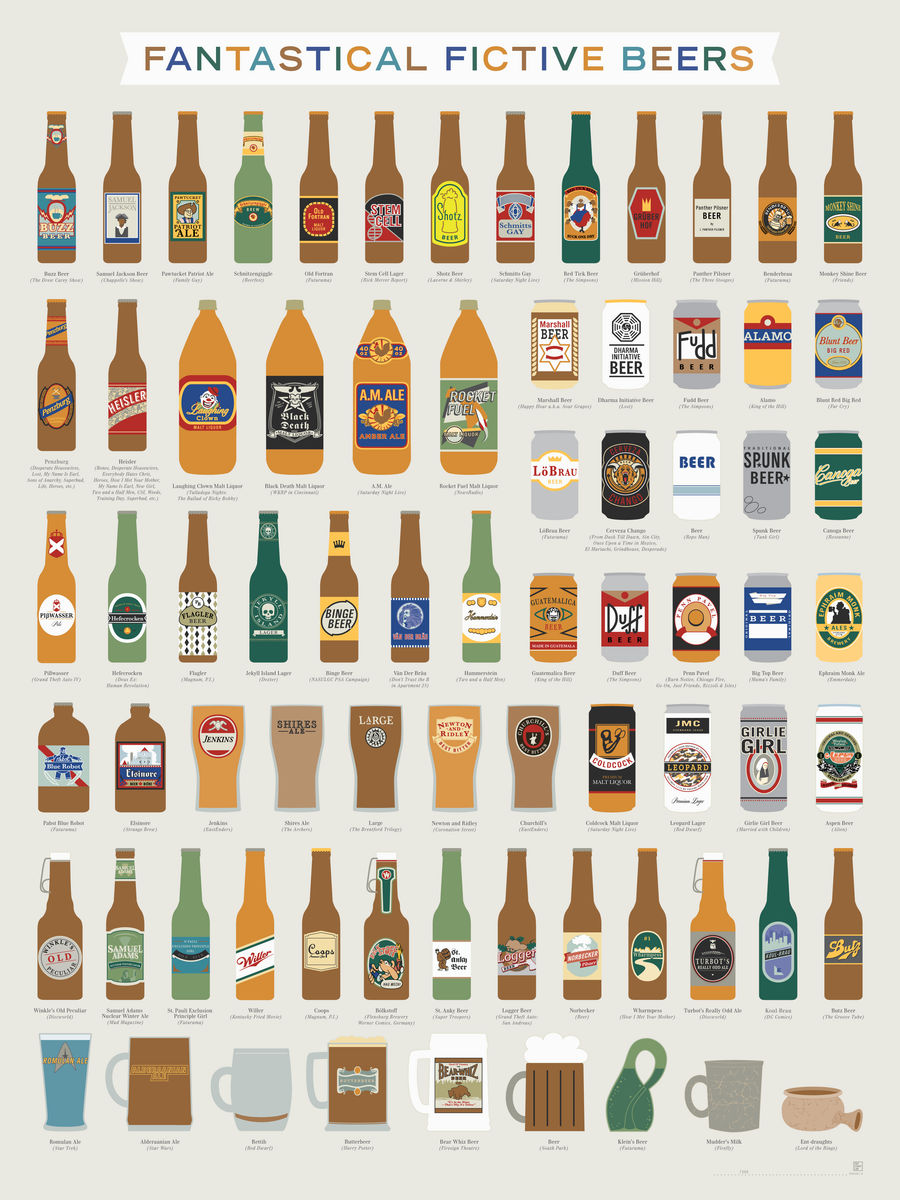
Chart: 71 Fictional Beers
Not content with mapping out over 500 actual beers, Pop Chart Lab has now cataloged 71 fictitious beers and beer-like substances from popular media. Everyone's heard of Butterbeer, but did you know about Heisler—an in-house fake beer from prop supplier Independent Studio Services—has been used in De...
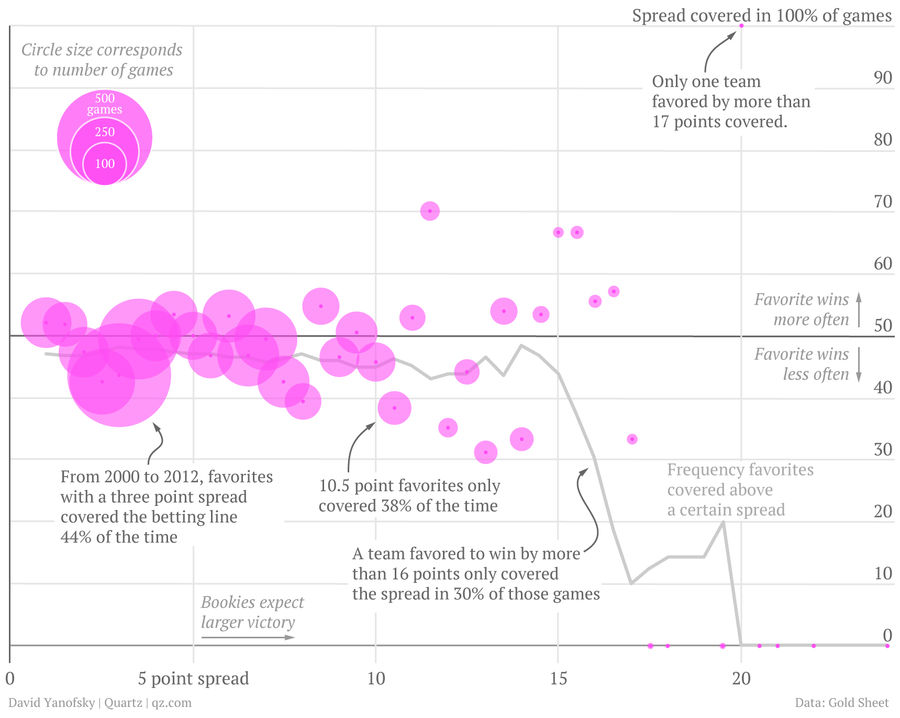
Chart: Friendly Reminder, Don't Bet On Favorites To Cover Huge Spreads
If you happened to bet on the Broncos to cover last week, David Yanofsky over at Quartz has put together a great chart to show just how much of a dumbass move that was....
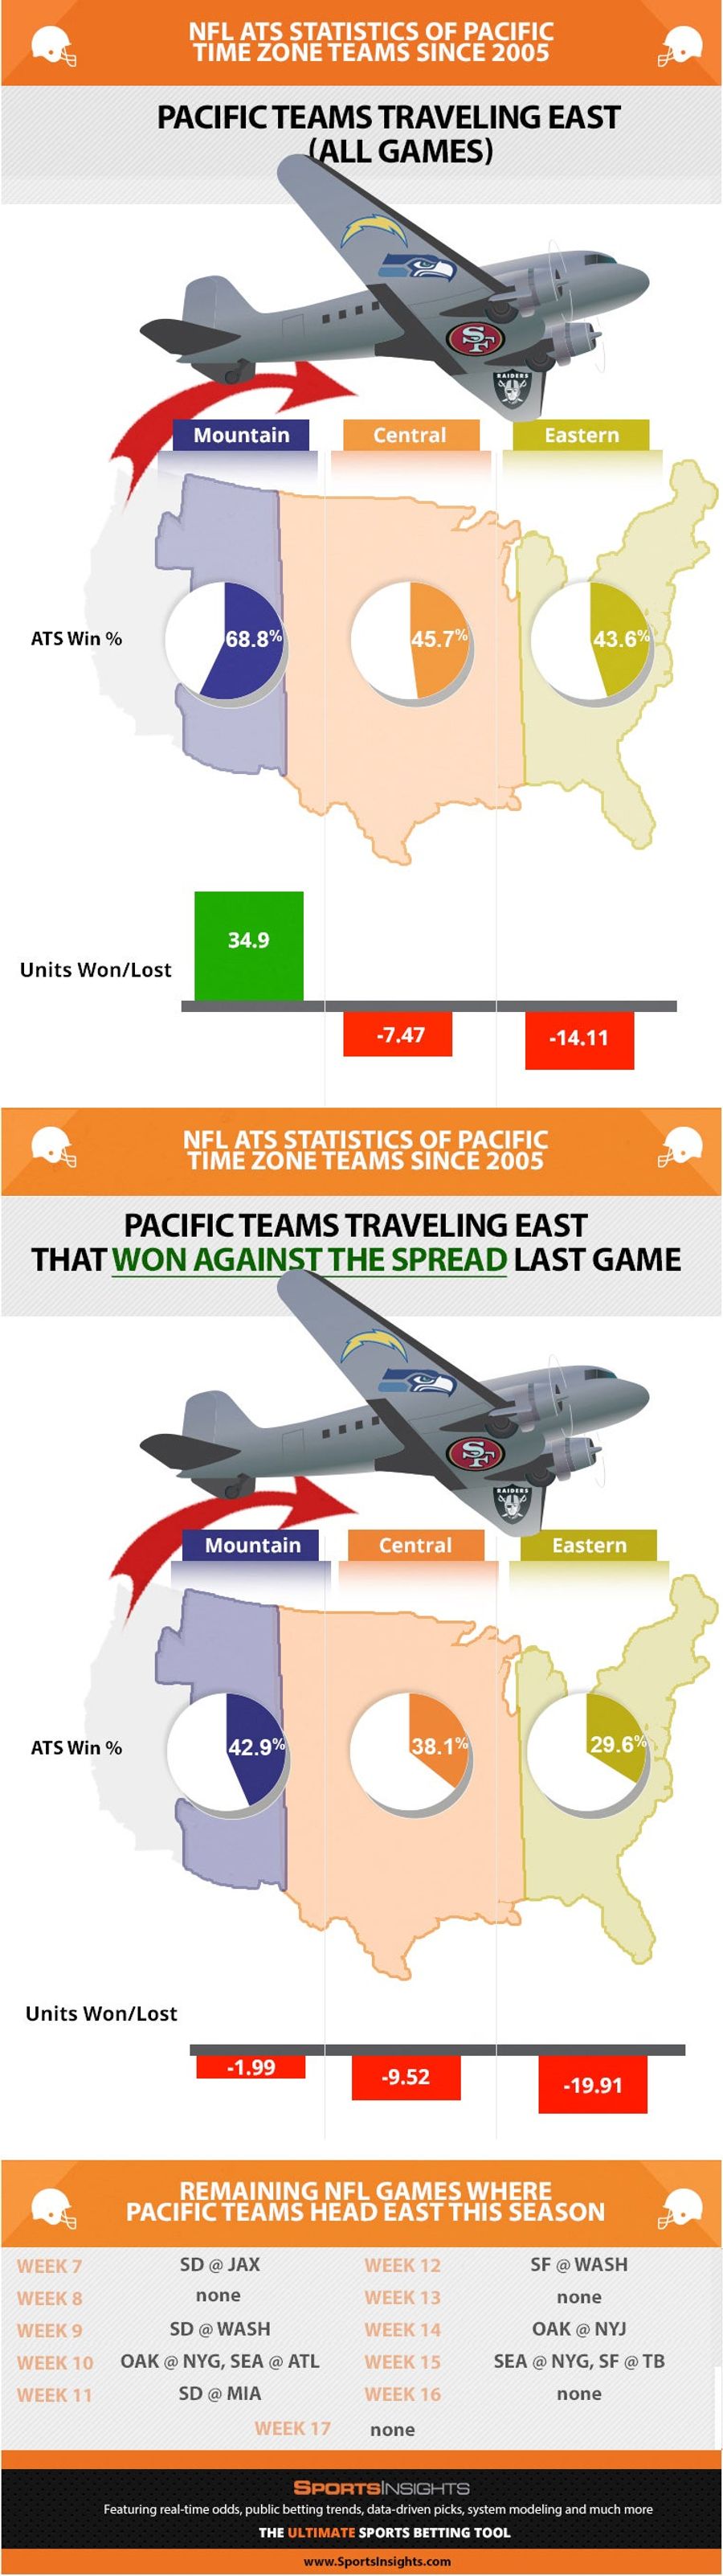
West Coast NFL Teams Coming East Really Do Suck Against The Spread
West coast teams don't do well when they have to come east. It's a betting wrinkle well known enough to be axiomatic, but here's a thorough reminder—with some additional facts you might not have known. ...
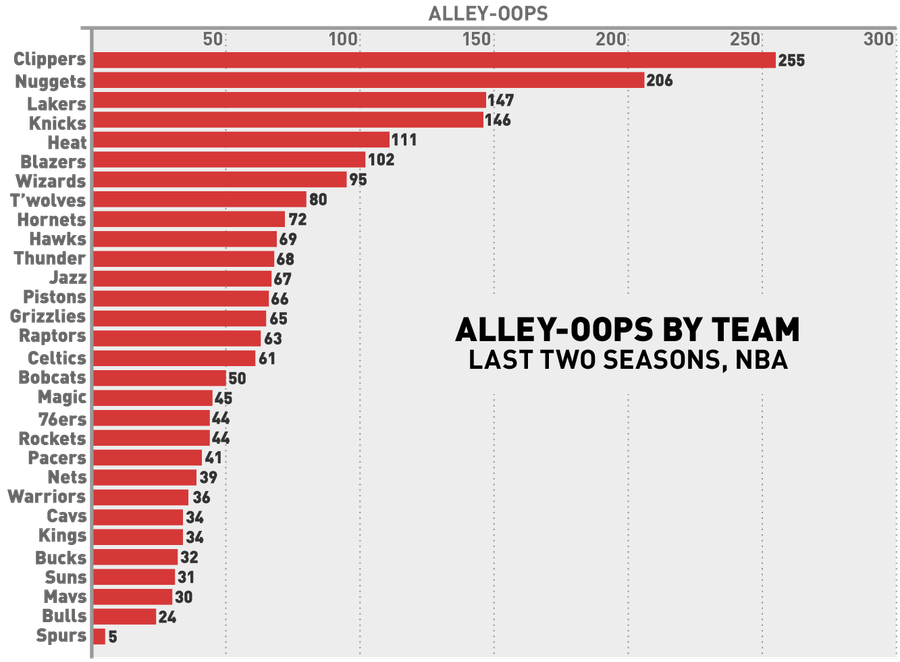
The Fun-Hating Spurs Threw Just One Alley-Oop Last Season
The chart above, based on data from NBA Stats, shows the number of alley-oops each team has thrown in the last two regular seasons. No surprises at the very top, although it's nice to see the mediocre/bad Blazers, Hornets, Timberwolves, and Wizards crack the top ten....
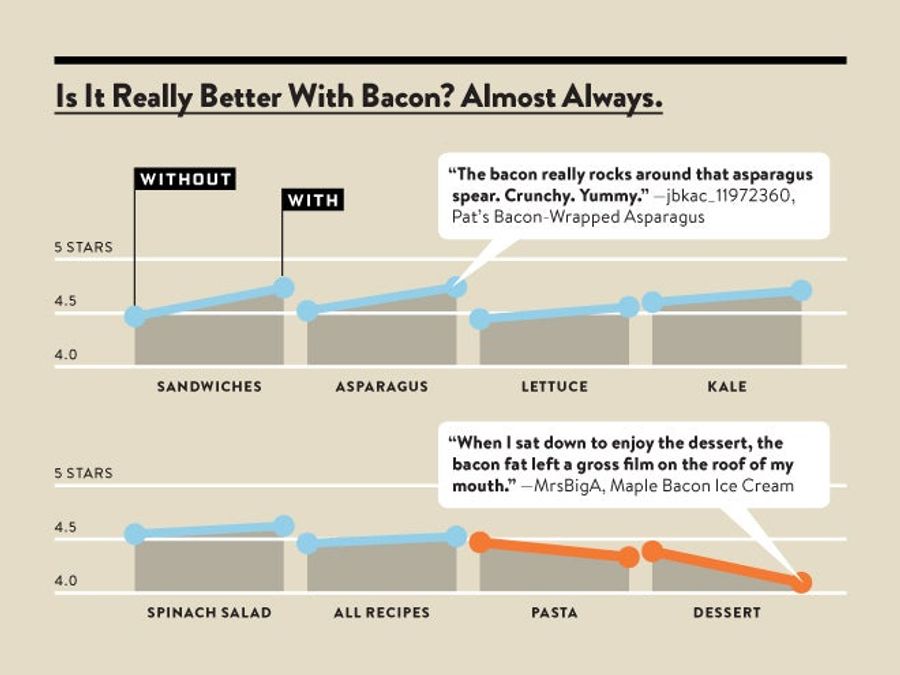
Science: Bacon Is The Ultimate Ingredient
While we always knew it within the thickening walls of our heaving hearts, Wired.com has managed to prove it empirically: Bacon does, in fact, make (nearly) everything better....
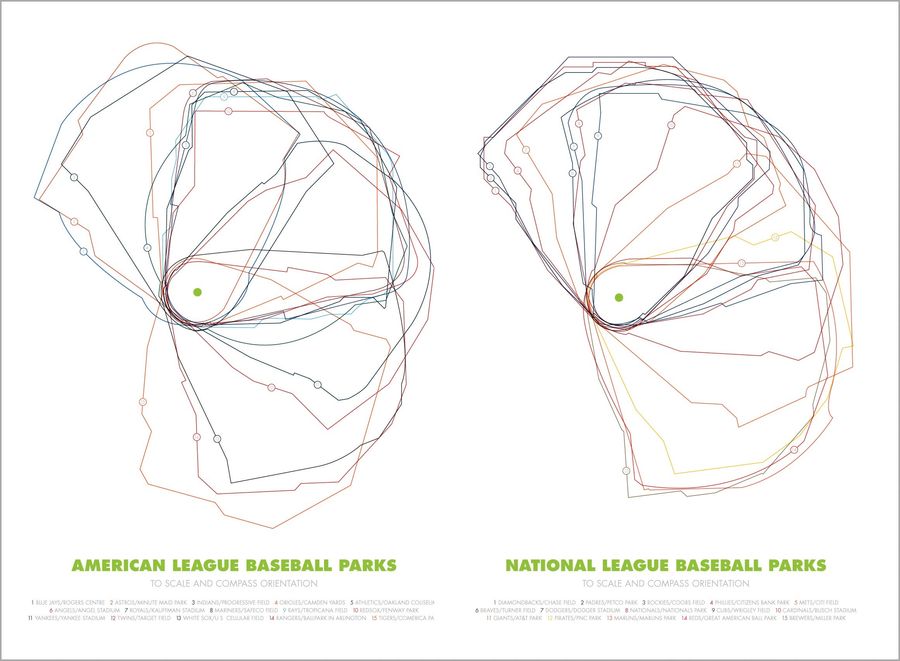
Infographics: Overlaying The Ballparks Of Major League Baseball
We've seen graphics that compare ballpark orientation (like this or this) and we've seen graphics that compare ballpark dimensions (here or here), but as far as we can remember, we've never seen a graphic do both at once. Here are some cool posters put together by designer Jeremy Huggins. It's alway...
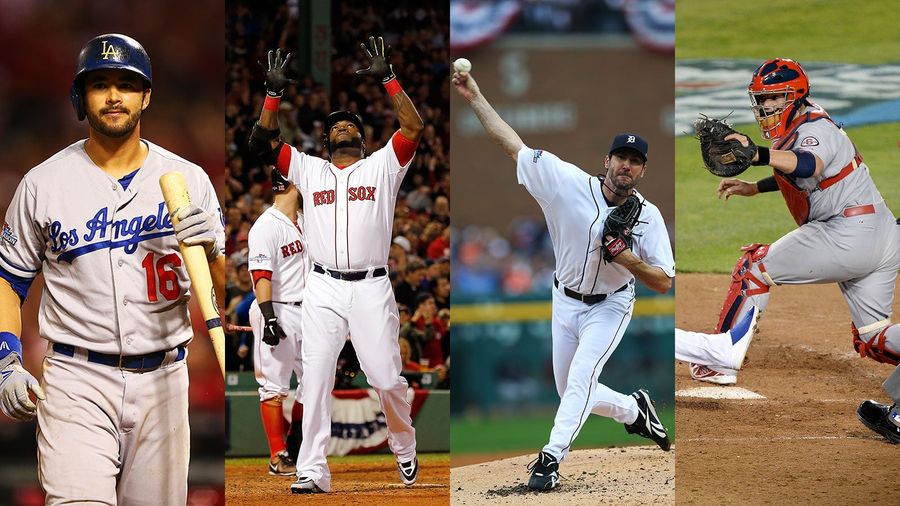
Charts: How Do You Build A Championship Baseball Team?
This season, the A's, Rays, and Pirates used front office wiles to build playoff-bound squads despite having minimal financial resources. Even with these feel-good stories eliminated, though, the four remaining teams still demonstrate that there are many good ways to build a competitive organization...
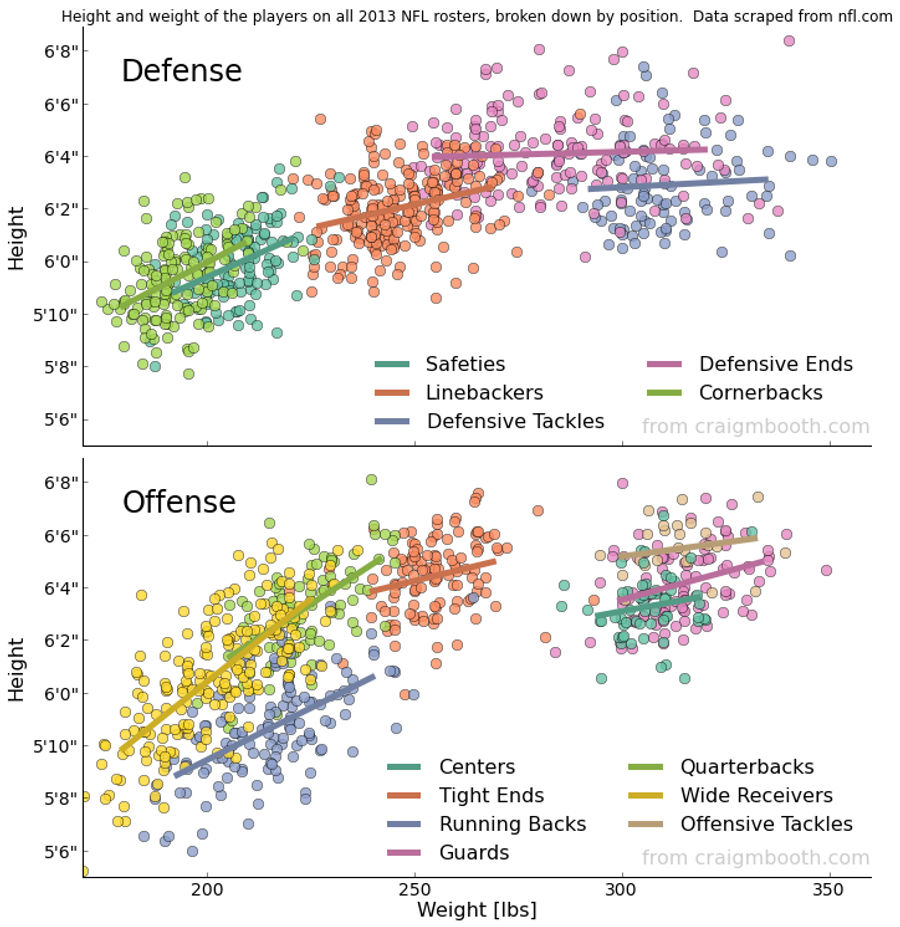
Chart: The Height And Weight Of Every NFL Player, By Position
Over on Reddit, user Craig Booth scraped the NFL's team roster websites for height and weight information and compiled it into the excellent graphic above....
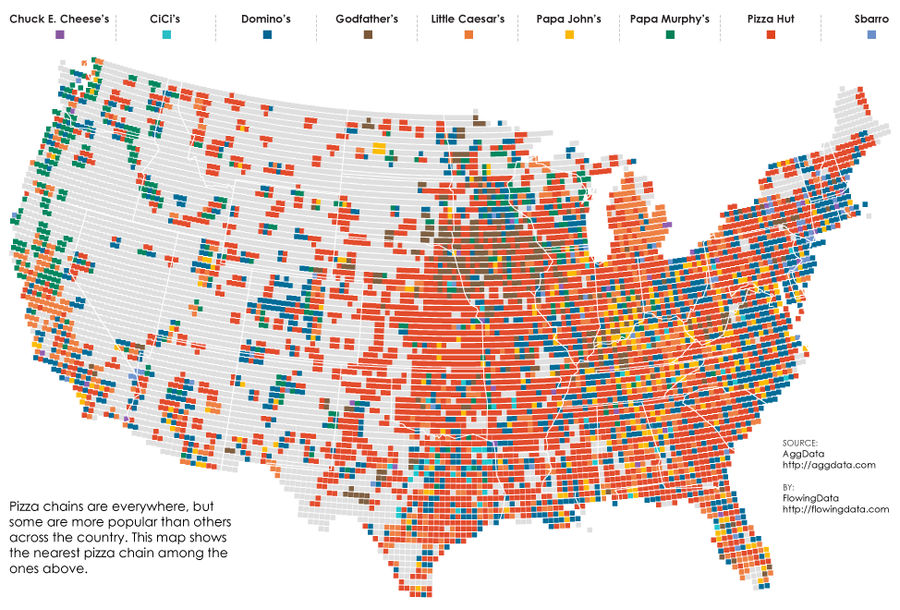
Map: What's The Nearest Pizza Chain?
The weird distribution of fast food across the United States is an endless source of conversation ("What do you mean you don't have Sonic?!"), and a pretty fun thing to map. We've seen these sorts of data visualizations for McDonald's, burger places, and breakfast haunts, but over at FlowingData, th...
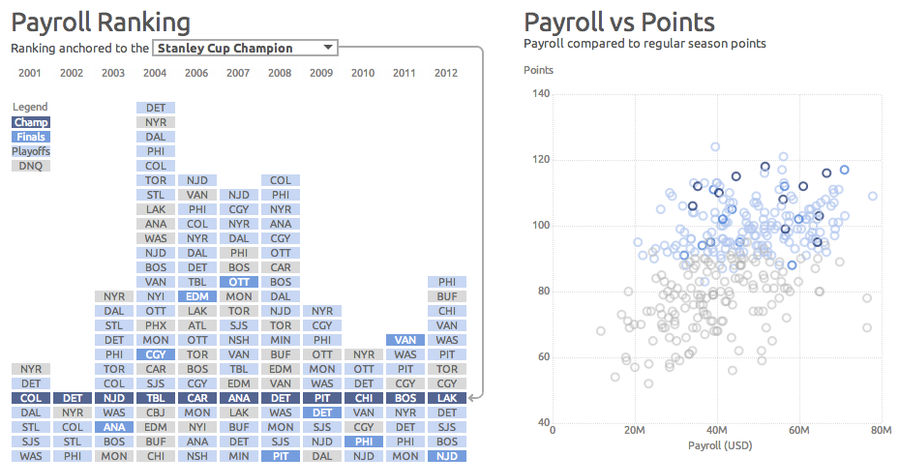
What Makes A Stanley Cup Champion? More Hockey Interactives To Explore
Continuing our industry-leading coverage of interactive hockey infographics, the charts above are a selection from an excellent piece of data viz by Dark Horse Analytics, which explore the relationship between payroll/attendance/offense/penalties and team performance....
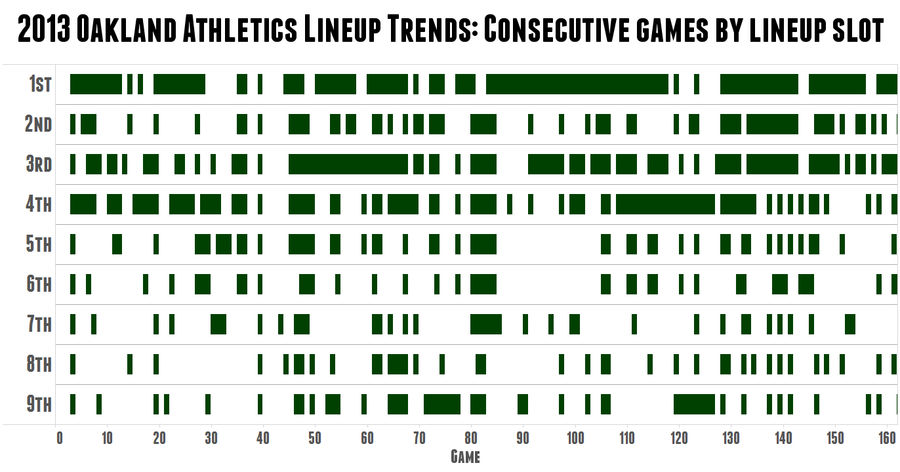
Cool Chart: A's Skipper Bob Melvin Is The King Of Platoons
Over at Sports on Earth, Jack Moore created this great graphic to demonstrate just how crazy A's manager Bob Melvin is about platoons. The green rectangles represent consecutive games in which the same hitter held the same spot in the batting order, with blanks showing a change from the previous gam...
Perfectly Timed Sports TV Graphics Are A Gift From God
We spend so much time here making fun of chyron mistakes that we sometimes forget to give thanks for the serendipitous moments where on-screen graphics and live action work in hilarious concert. ...
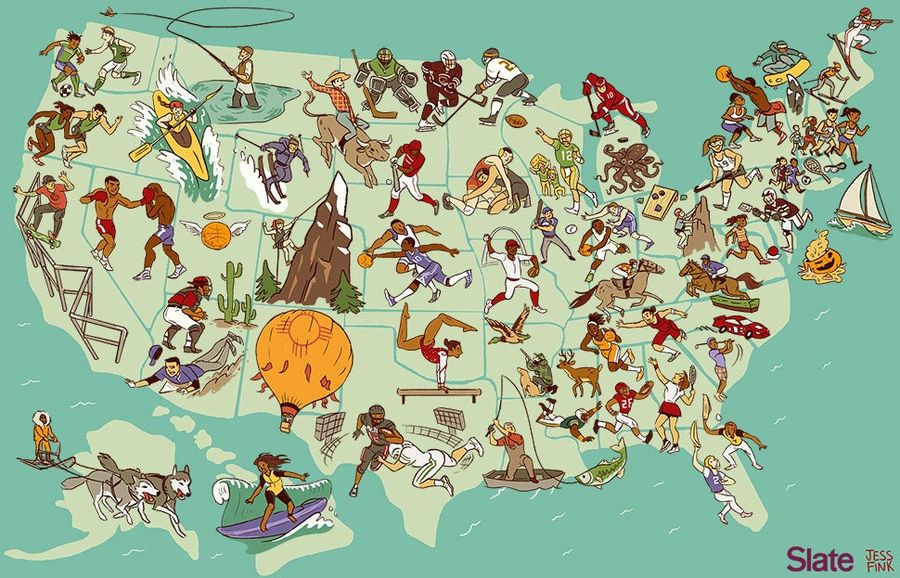
Awesome Map: The United States Of America, By Regional Sport
What sport can each state lay claim to? The map above, by Josh Levin and Jess Fink of Slate, attempts to answer this fun but fascinating question, picking 51 sports to dish out across the country. The results range from awesome (mountain climbing in Colorado) to goofy (cornhole in Ohio) to extremely...
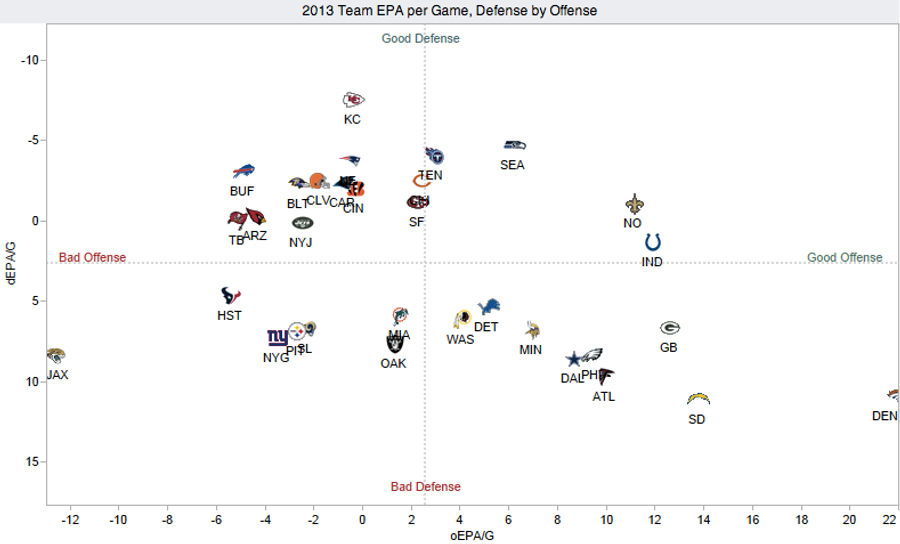
Chart: How Does Your NFL Team Stack Up On Offense and Defense?
Over at Advanced NFL Stats, Brian Burke has put together a great visualization plotting the offensive and defensive performance of the league's 32 teams. It's nothing too complicated—basically a NYMag Approval Matrix for football—but it reveals a lot about the state of the NFL through Week 5....
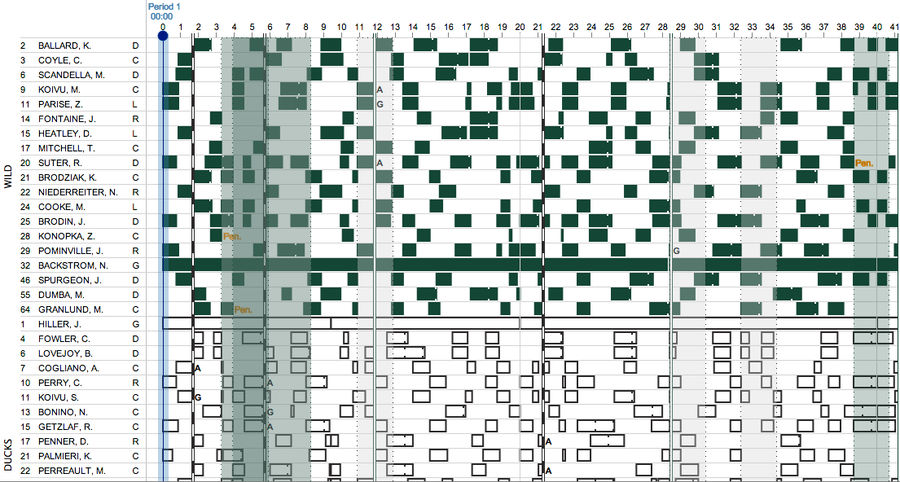
Who The Hell's On The Ice? Cool Interactive Explores Hockey Line Changes
It's hard enough to follow the puck in televised hockey, so forget about tracking the many, many on-the-fly line changes. Luckily ShiftChart, a sample of which you see above, is here to do the work for you. ...
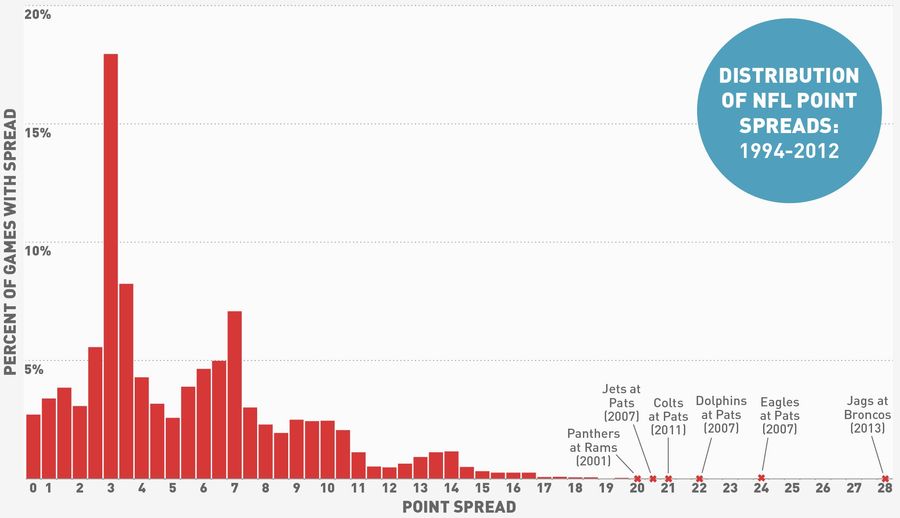
What's More Improbable: The Jaguars' +28 Line Or An 11-Inch Penis?
The murmurs began last week, before the Broncos put up 51 points against the Cowboys and the Jaguars lost second-overall pick Luke Joeckel to injury. And when the dust of Week 5 had settled, sure enough, the betting line for Jaguars at Broncos was set at 28 points, which is a lot....
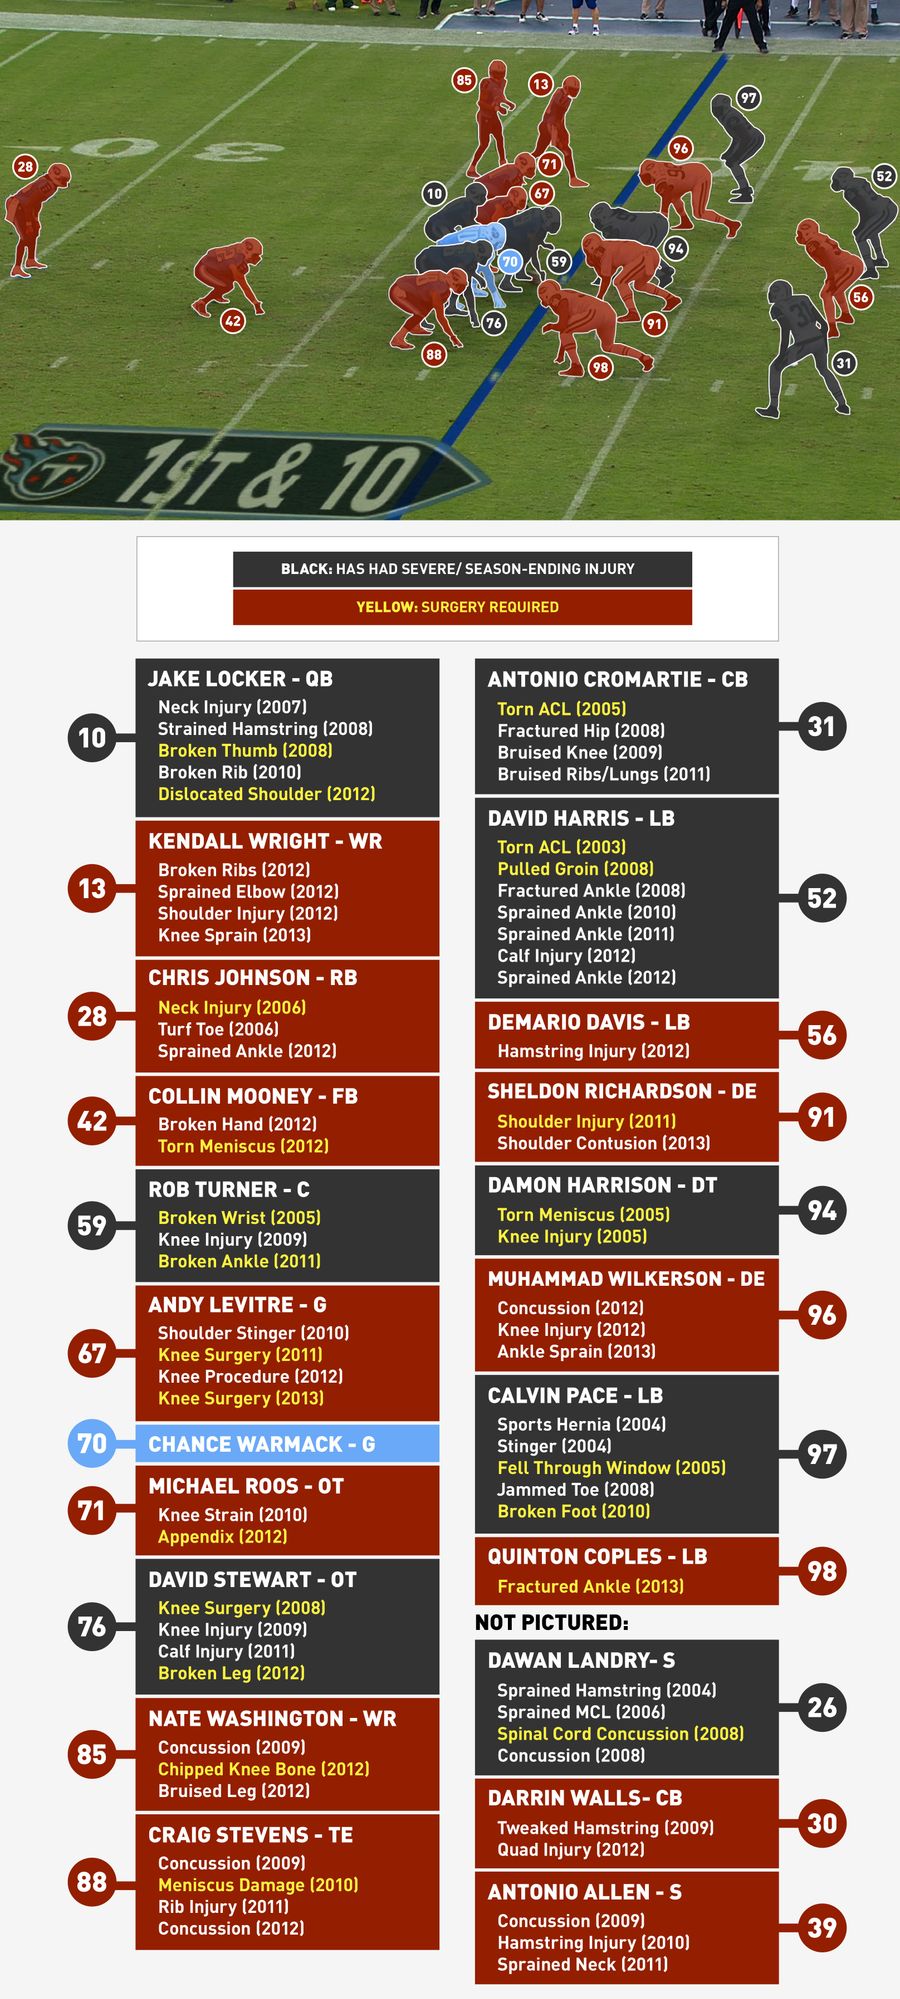
The Injury History Of Everyone On The Field When Jake Locker Got Hurt
Four seconds into the play above, Jake Locker took an awkward double hit from Muhammad Wilkerson and Quinton Coples and had to be carted off the field with a hip injury. If anyone could sympathize, it was, well, everyone else on the field....
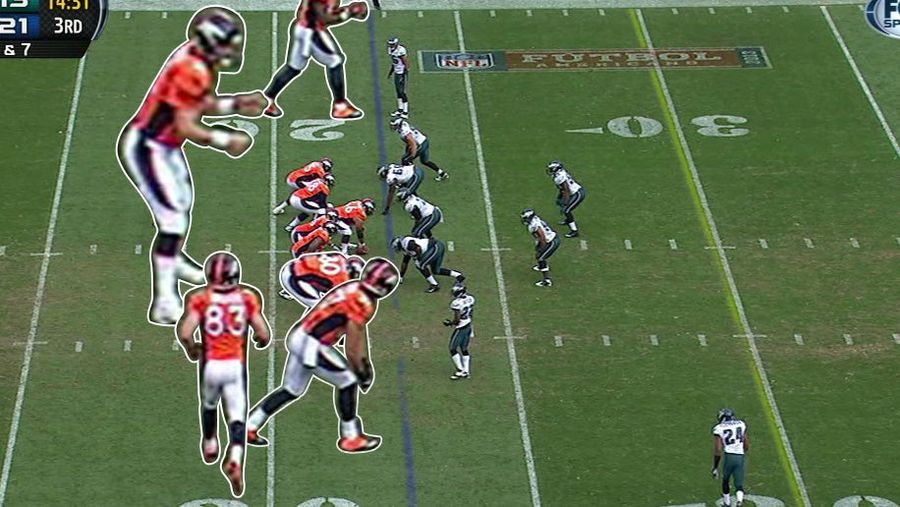
Infographics: Every NFL Offense's Production, Visualized By Position
Instinctively, you know every team has strengths and weaknesses. You see it in the box scores and the advanced metrics, but when the teams line up, a shitty running back doesn't look impossibly different from Adrian Peterson. So, here's a visual aid. Every NFL offense, visualized by how each of the ...
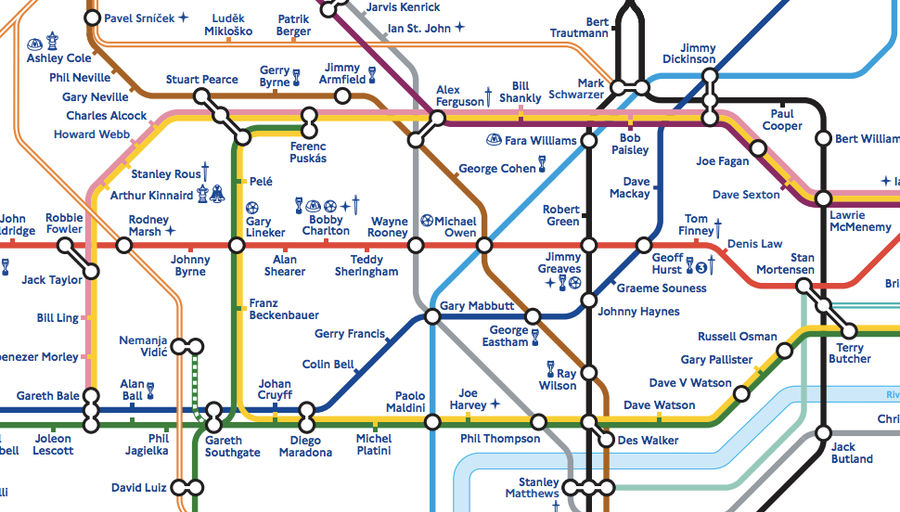
London Tube Map Redrawn With Footballer Names; England Rejoices
England's Football Association and the London Tube both turned 150 this year, so in commemoration the FA has released a neat soccer-themed version of the famed Tube map. As you can see in the excerpt above, each of the systems's near-400 stations (including the overgrounds) has been replaced by a no...