
Chart: How Does Your NFL Team Stack Up On Offense and Defense?

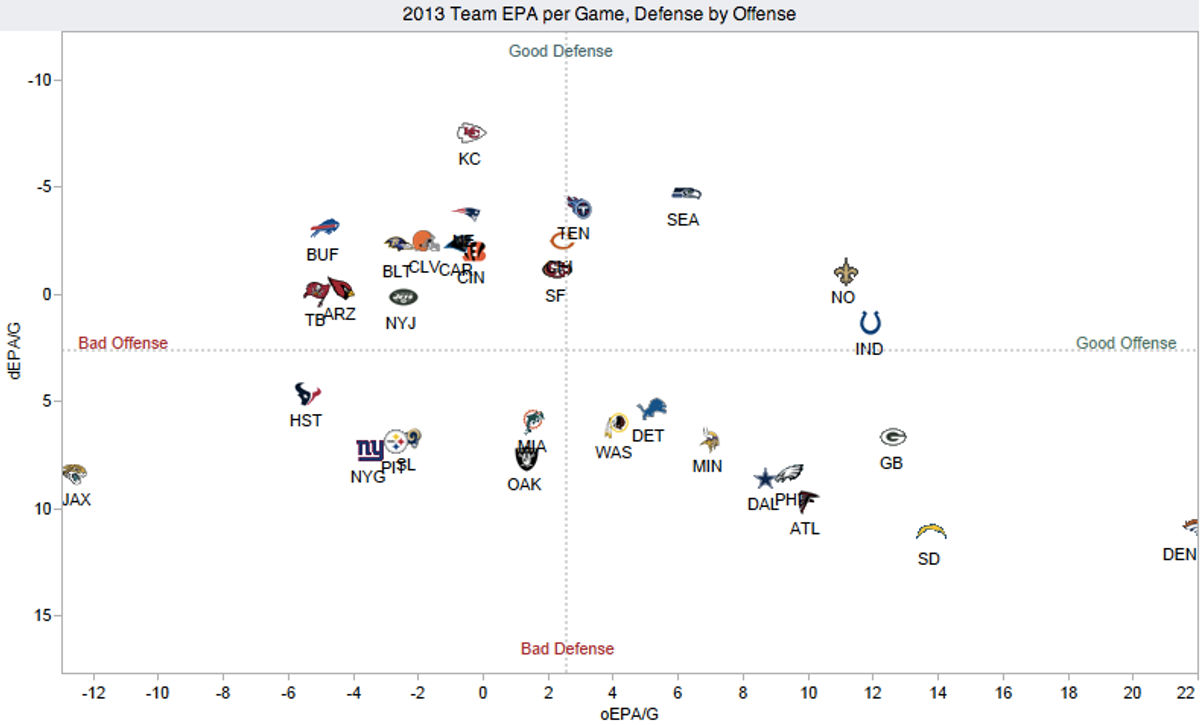
Over at Advanced NFL Stats, Brian Burke has put together a great visualization plotting the offensive and defensive performance of the league's 32 teams. It's nothing too complicated—basically a NYMag Approval Matrix for football—but it reveals a lot about the state of the NFL through Week 5.
The measurement here is expected points added (EPA) per game, which sums how much a team's offense has increased the odds of scoring, or a team's defense has decreased those odds, following every play ( similar to RE24 in baseball). This type of stat acknowledges that not all situations are equal—yards per game might be a useful comparative figure, but five yards on 2nd and 10 and five yards on 3rd and 4 aren't the same thing. The axes are set at the league averages, so even a slightly negative EPA defense like the Colts can qualify as "good" in today's NFL.
The scales had to be adjusted to fit the Broncos, but who would have guessed that the Colts attack would come in fourth? How many more points does Matt Schaub have to hand his opponents before the Texans' offense drops below the Jags? And what teams are going to distinguish themselves from the "decent D/medicore O" clusterfuck in the top left? Stay tuned, these update every week.
Related


What Prediction Markets Are Telling Us About NFL 2026 MVP

The Sacramento Kings Need to Blow It Up Before It's Too Late


Ben Askren Didn't Win the Match—But He Won the Weekend

- UFC Fight Night Best Betting Picks for Du Plessis vs. Usman in OKC
- France vs. England Best Bets: Three Picks for the World Cup Third-Place Match
- Dodgers vs. Yankees Friday July 17 Best Betting Picks and Props
- July 17 White Sox vs. Blue Jays Prediction, Odds and Best Bets
- Three MLB Futures Bets to Make After the All-Star Break
- Three Heisman Trophy Sleepers Worth Betting Before the 2026 Season
- England vs. Argentina Best Bets: Three Picks for the World Cup Semifinal
