
graphic Page 6 - Sports News, Headlines & Highlights
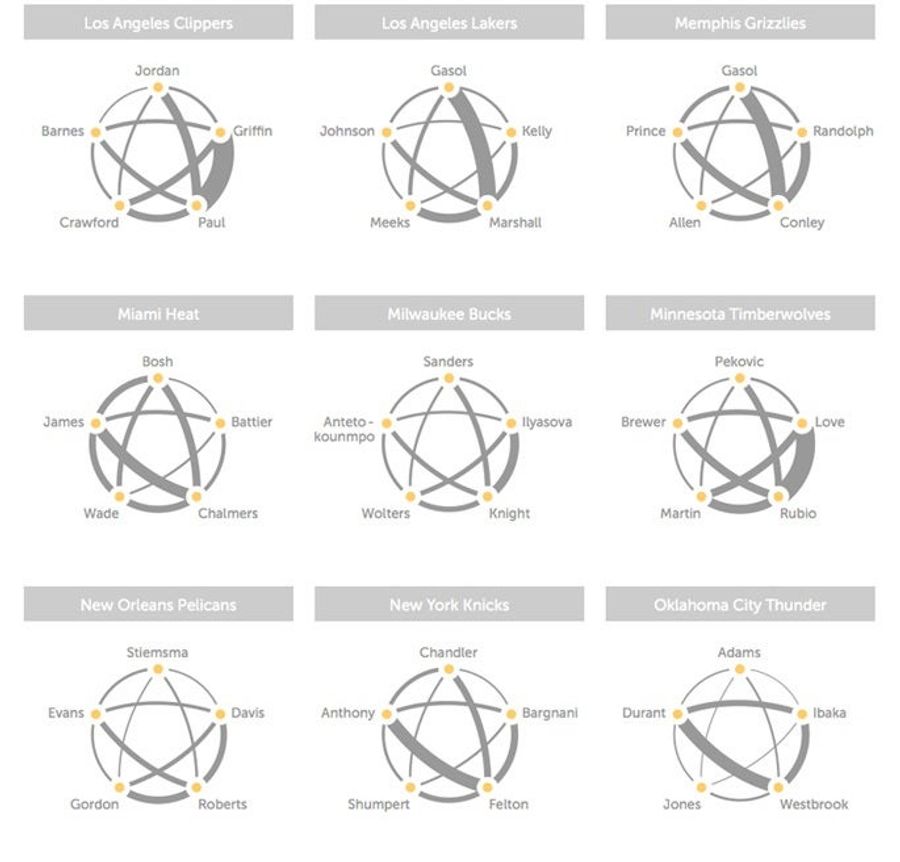
These Beautiful Charts Show How Well Your NBA Team Spreads The Ball
In another cool application of SportVU technology, Andrew Bergmann of the Hangtime blog on NBA.com has put together some beautiful charts showing how often different NBA starters pass to each other....
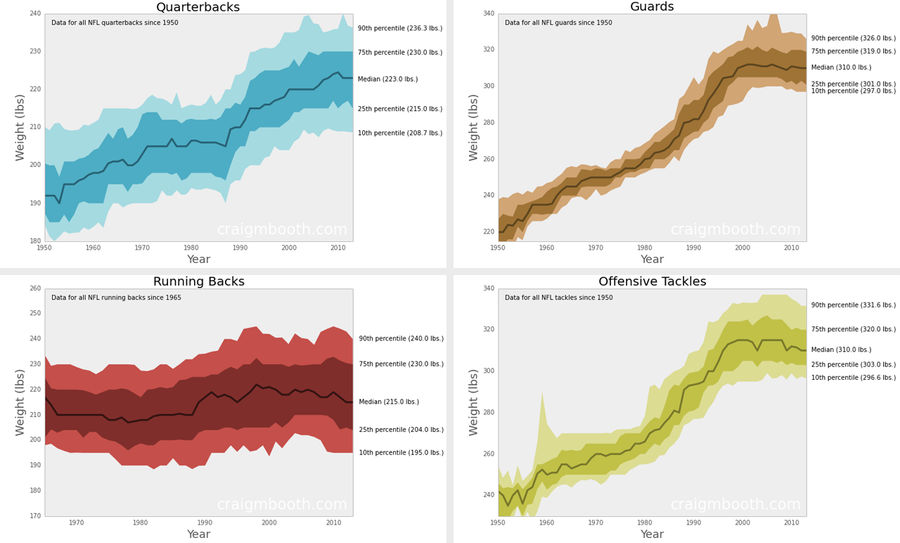
How Have The Weights Of NFL Positions Changed Over Time?
Craig Booth—who previously made those NFL height/weight charts—just released a great series of graphics showing how the median weights of various positions have changed since 1950, based on data from Pro Football Reference. Booth isn't the first to visualize this sort of trend, but the inclusion of ...
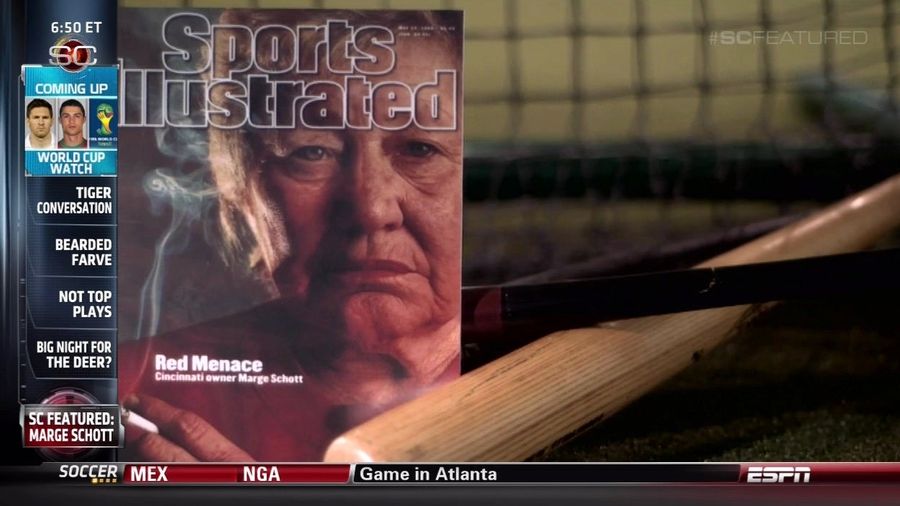
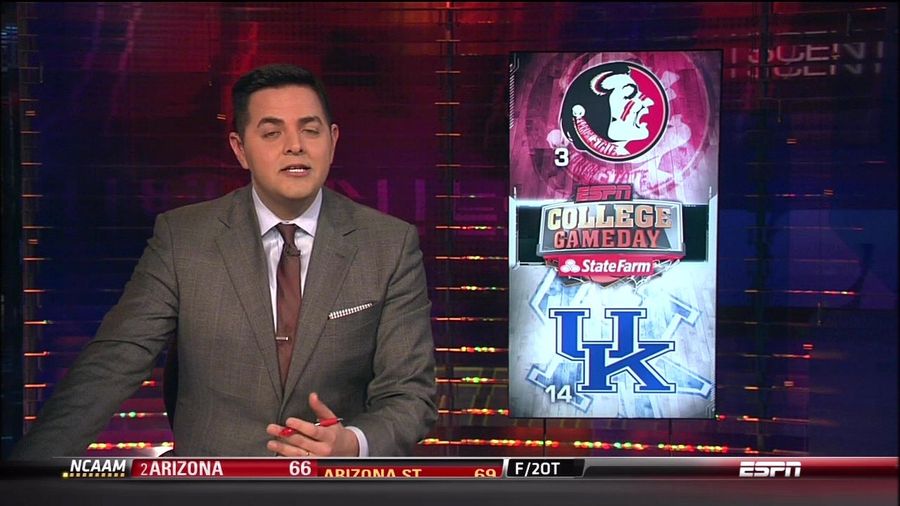
ESPN: Living In The Past
Send stories, photos, and anything else you might have to [email protected]....
I Heard His Son Is Pretty Good, Too
Send stories, photos, and anything else you might have to [email protected]....
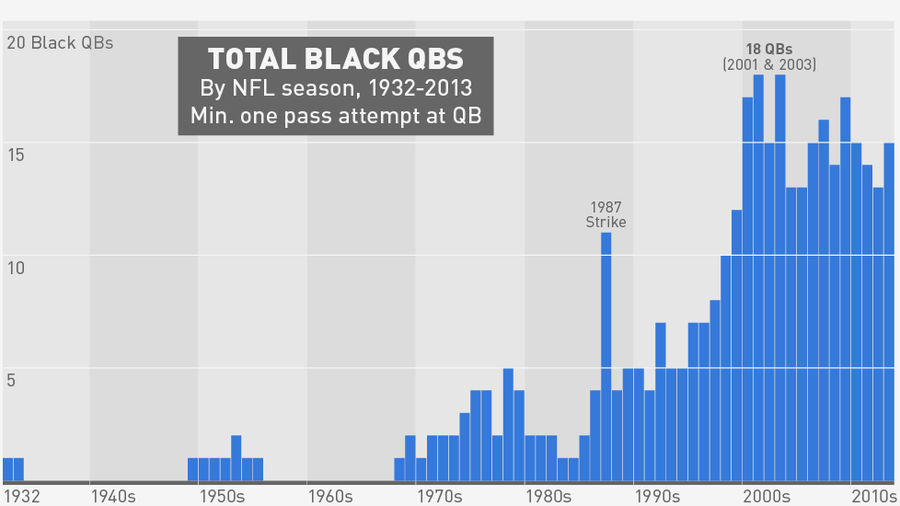
Was 2013 Really The Golden Age Of The Black Quarterback?
Charts excerpted from The Big Book Of Black Quarterbacks, published Feb. 6th....
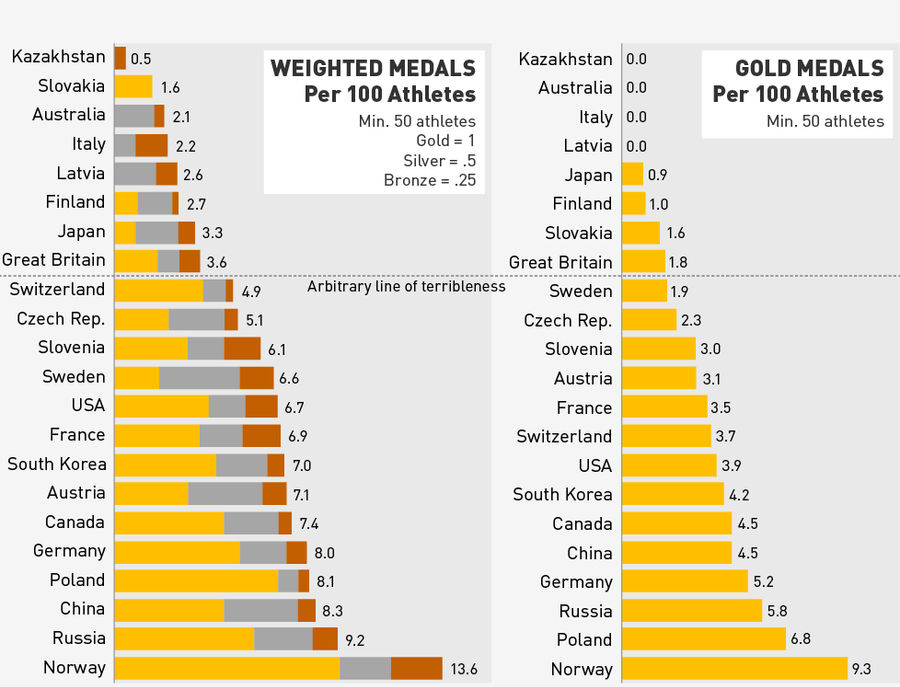
So, Which Countries Had The Worst Olympics?
After the usual agonizing about who's winning the Olympics—Do you use medal count or gold count? What about something weighted? WHAT ABOUT GDP?—Russia made things relatively easy at the end of the day, seemingly establishing itself as the consensus winner....
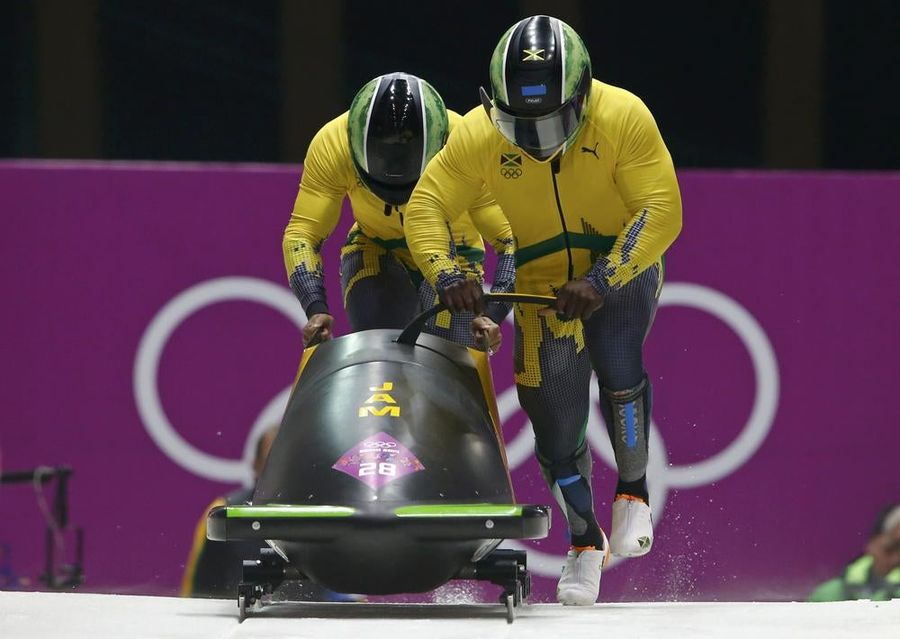
Which Winter Olympic Sport Has The Biggest Athletes?
Originally published on Mode Analytics....
No, That's Not Right
Send stories, photos, and anything else you might have to [email protected]....

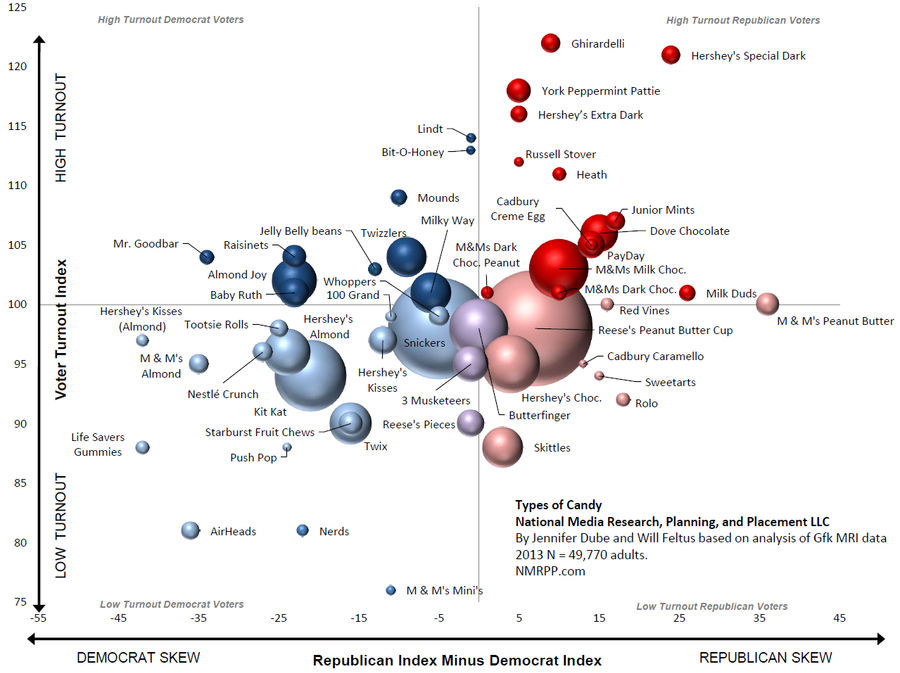
Chart: Does Your Choice Of Candy Reveal Your Politics?
We already covered this for booze, but the research firm NMRPP has released a chart showing the political leanings (x-axis) and voter turnout (y-axis) of various major candy brands. Bubble size is proportional to the population of survey respondents who ate each type of candy....
Where Olympic NHLers Are Coming From
16 Wins has put together this animated infographic showing each NHL team's contributions to Olympic rosters. I'd prefer an interactive version that lets me actually stop and look at each nation, but I get the idea....
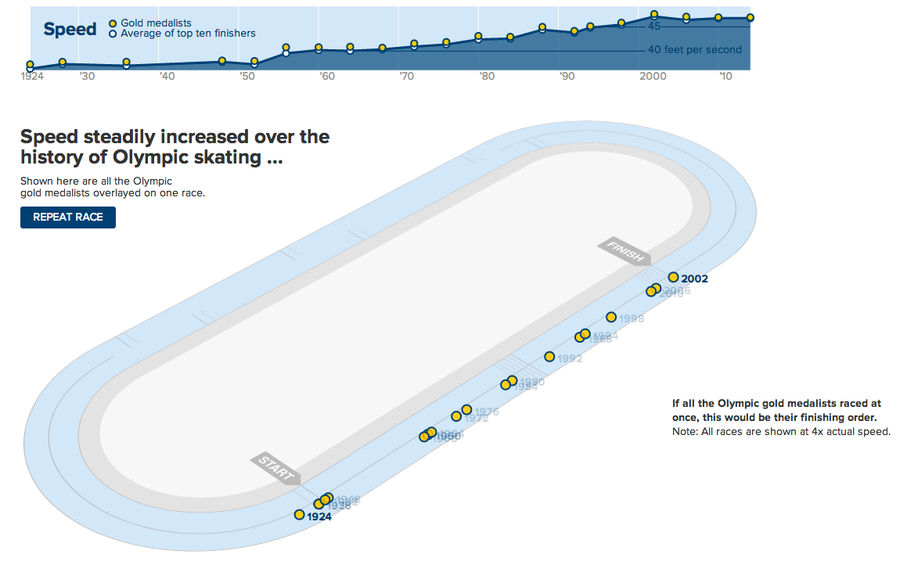
Speed Skaters Have Gotten A Lot Faster Since 1924
Similar to what The New York Times did for the 100m dash in 2012, The Wall Street Journal has developed a great graphic to show just how much faster the top speed skaters have gotten over the years. The still above is part of an animation pitting every male 500m gold medalist against each other; the...
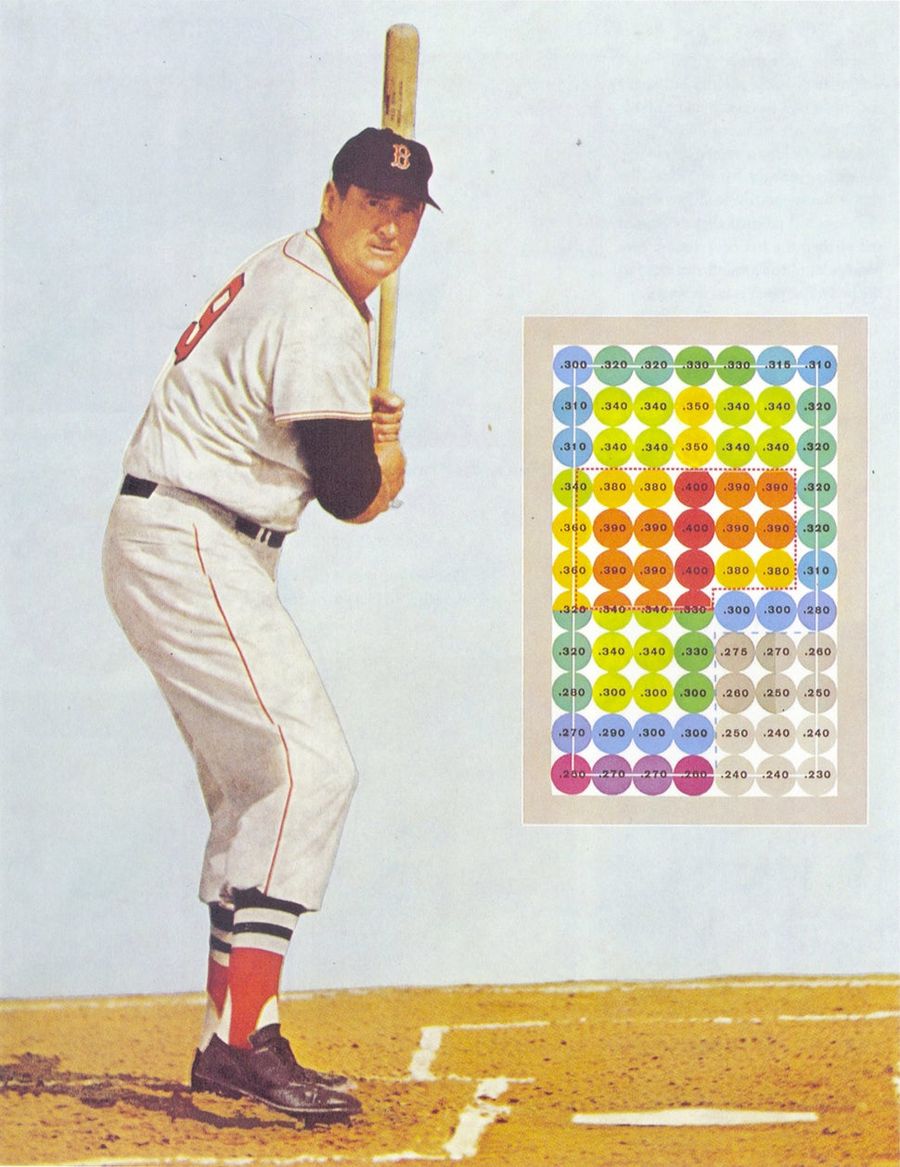
The Beautiful Infographics Of Ted Williams's <em>The Science Of Hitting</em>
In 1971, Ted Williams and John Underwood released The Science of Hitting, the definitive treatment of the subject. Few great athletes have ever been so articulate about the mechanics of their greatness, which is one reason the book holds up even today, well into the analytics era. (A decade ago, Sci...
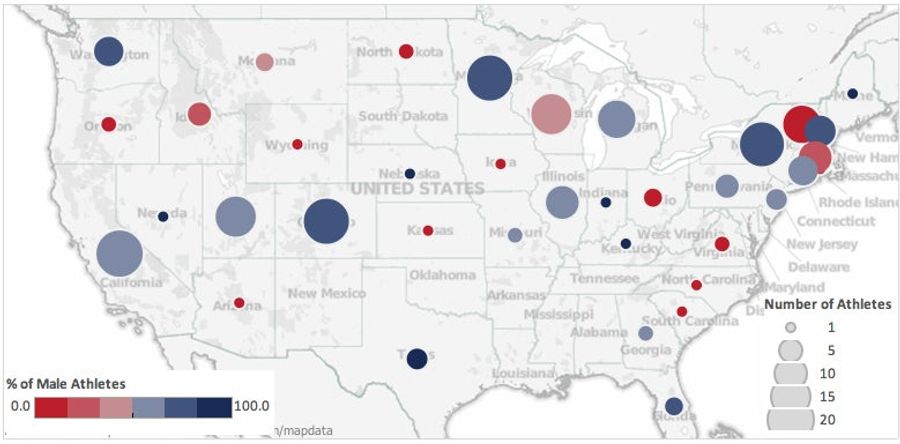
Where Do Our Winter Olympians Come From?
This morning, the Washington Post published a map and list of the home states of the U.S.'s Winter Olympians. Commenter Jessica Minton wasn't a fan, so she took the data and created her own interactive map that breaks down the states' athletes by gender and by sport....
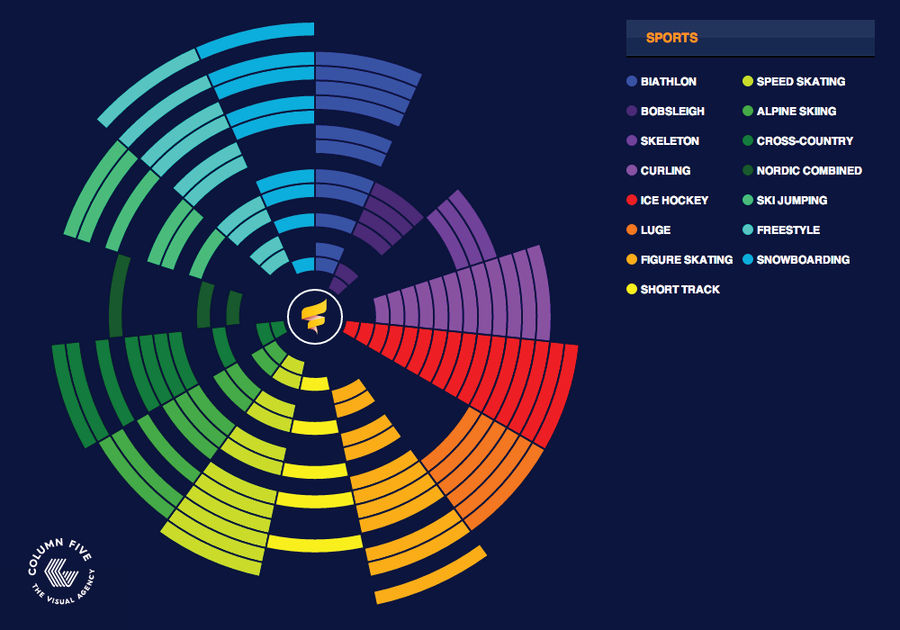
This Interactive Olympic Calendar Is Useful And Pretty
You'll want to bookmark this interactive calendar, produced by Column Five Media. It's an intuitive way to sort the Sochi goings-on by sport and date, and the events are listed by an actual American time zone....

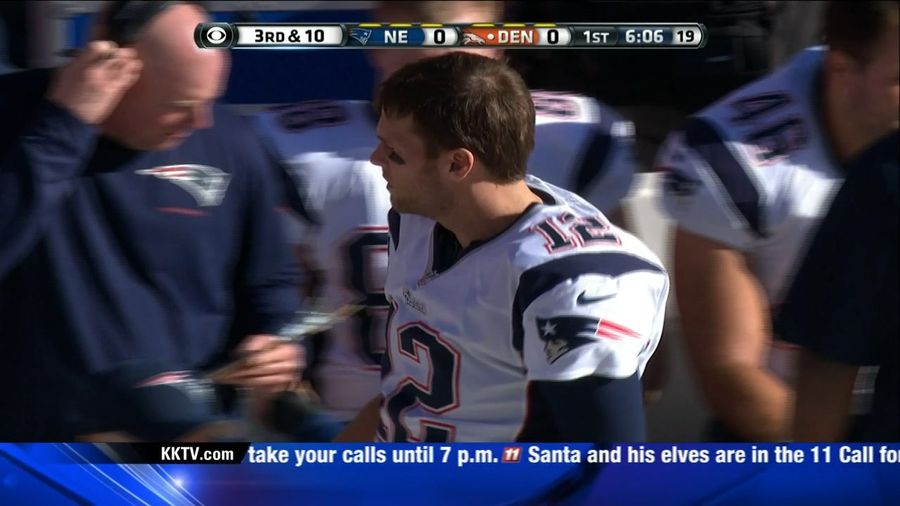
Colorado Viewers Miss Six Minutes Of AFC Title Game, Learn About Santa
Somehow this flew under the radar all week, but it turns out Broncos fans in Colorado Springs missed much of the first quarter during Sunday's AFC Championship game due to technical difficulties on KKTV—during which Tom Brady was frozen on their screens for nearly six minutes. Even stranger, the CBS...
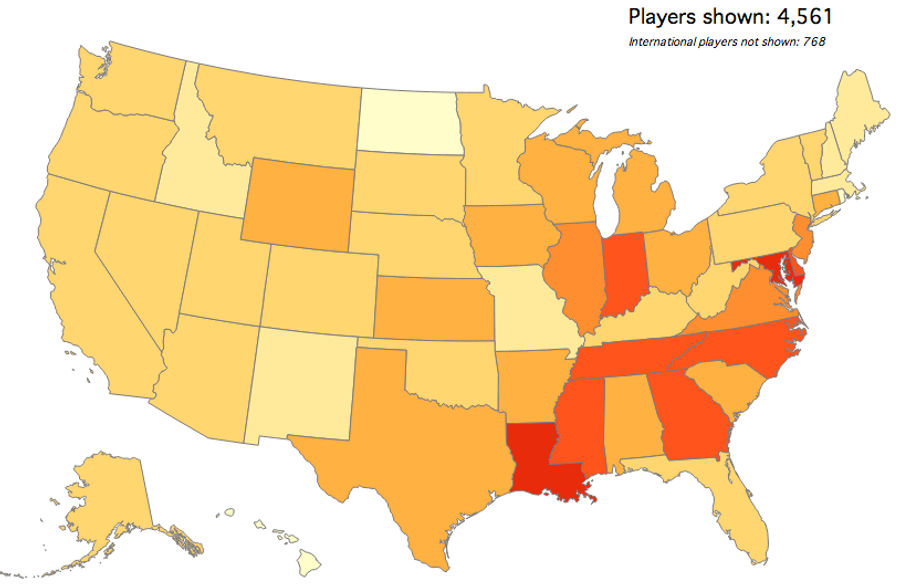
Map: Which States Produce The Most College Basketball Recruits?
Mode Analytics, which previously mapped out where college football players are from, has turned its attention to the much more timely sport of college basketball. The map above shows which states have produced the most current D1 players, relative to their college-age male populations....