
infographic Page 4 - Sports News, Headlines & Highlights
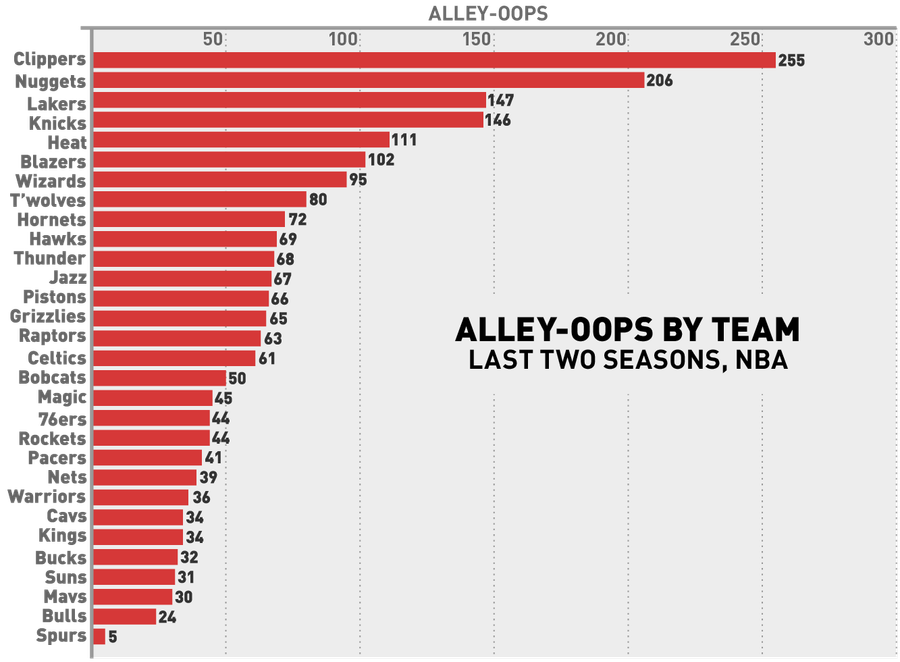
The Fun-Hating Spurs Threw Just One Alley-Oop Last Season
The chart above, based on data from NBA Stats, shows the number of alley-oops each team has thrown in the last two regular seasons. No surprises at the very top, although it's nice to see the mediocre/bad Blazers, Hornets, Timberwolves, and Wizards crack the top ten....

Charts: How Do You Build A Championship Baseball Team?
This season, the A's, Rays, and Pirates used front office wiles to build playoff-bound squads despite having minimal financial resources. Even with these feel-good stories eliminated, though, the four remaining teams still demonstrate that there are many good ways to build a competitive organization...
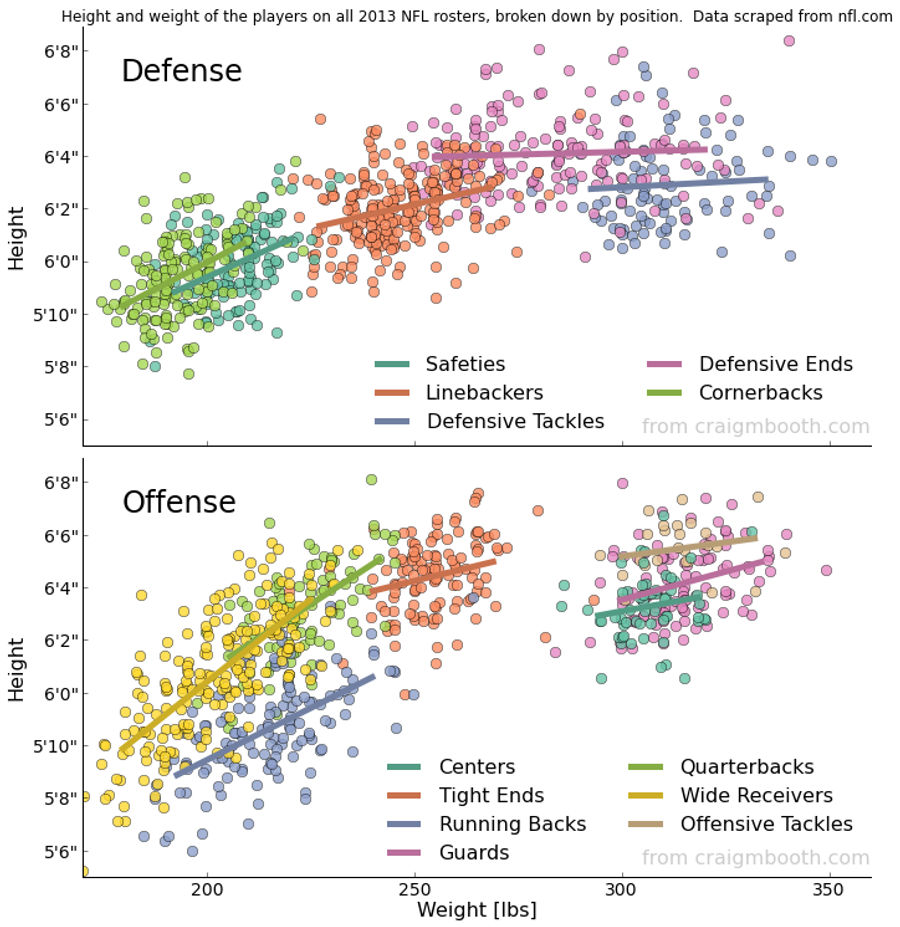
Chart: The Height And Weight Of Every NFL Player, By Position
Over on Reddit, user Craig Booth scraped the NFL's team roster websites for height and weight information and compiled it into the excellent graphic above....
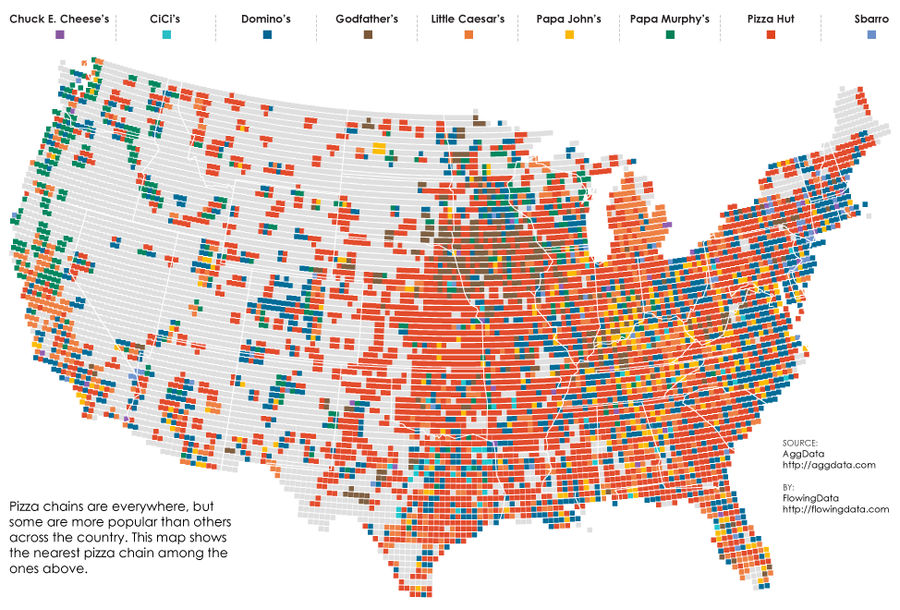
Map: What's The Nearest Pizza Chain?
The weird distribution of fast food across the United States is an endless source of conversation ("What do you mean you don't have Sonic?!"), and a pretty fun thing to map. We've seen these sorts of data visualizations for McDonald's, burger places, and breakfast haunts, but over at FlowingData, th...
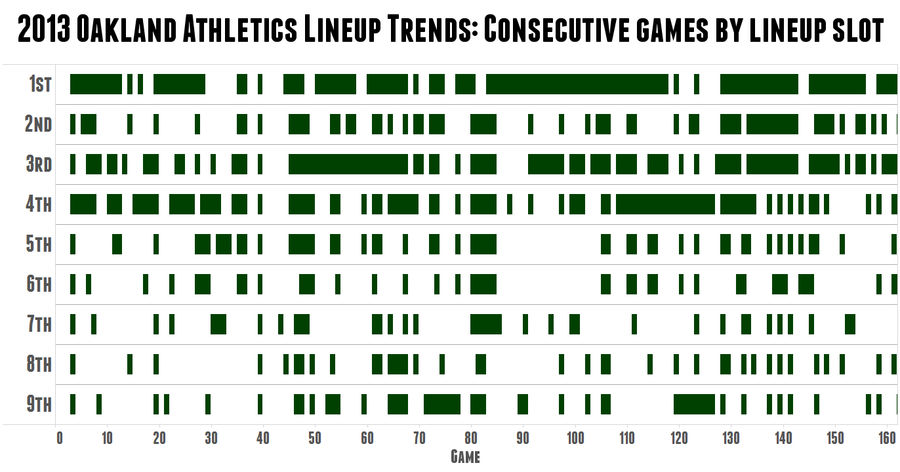
Cool Chart: A's Skipper Bob Melvin Is The King Of Platoons
Over at Sports on Earth, Jack Moore created this great graphic to demonstrate just how crazy A's manager Bob Melvin is about platoons. The green rectangles represent consecutive games in which the same hitter held the same spot in the batting order, with blanks showing a change from the previous gam...
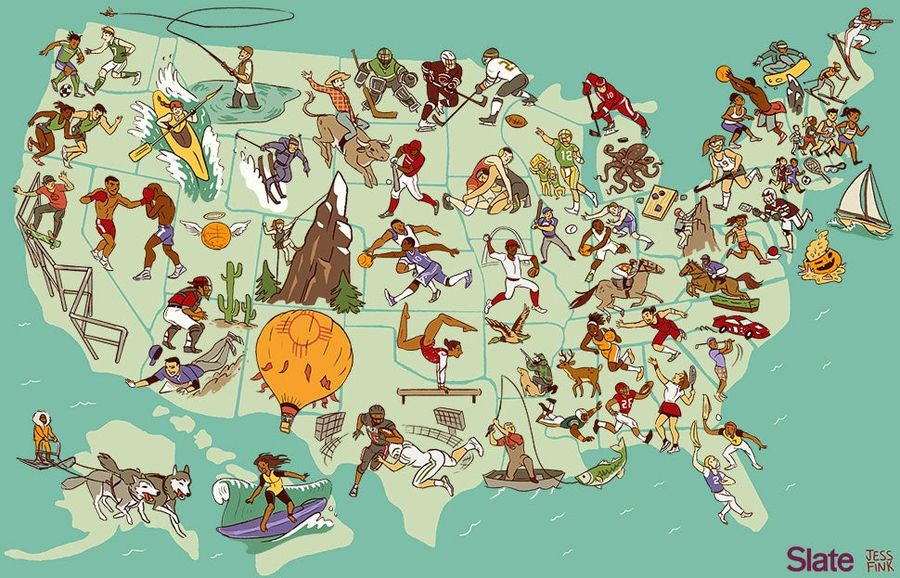
Awesome Map: The United States Of America, By Regional Sport
What sport can each state lay claim to? The map above, by Josh Levin and Jess Fink of Slate, attempts to answer this fun but fascinating question, picking 51 sports to dish out across the country. The results range from awesome (mountain climbing in Colorado) to goofy (cornhole in Ohio) to extremely...
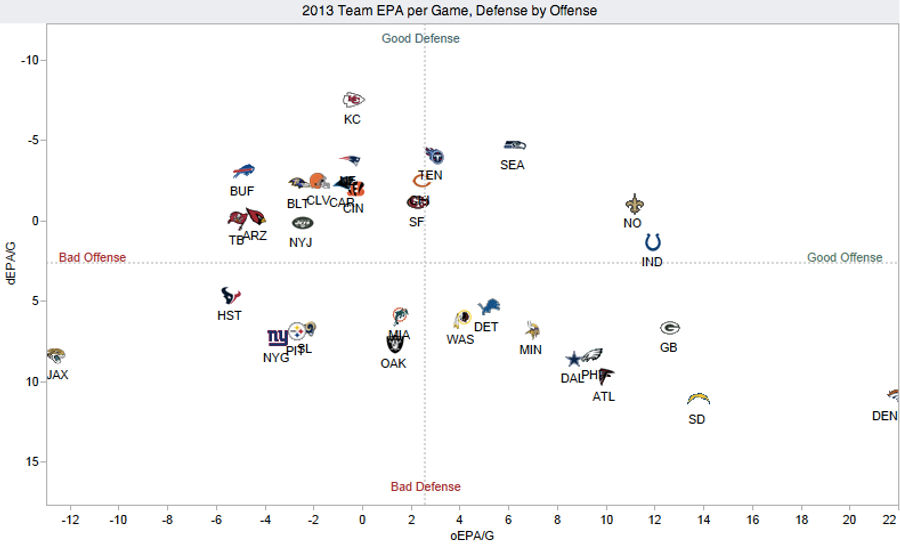
Chart: How Does Your NFL Team Stack Up On Offense and Defense?
Over at Advanced NFL Stats, Brian Burke has put together a great visualization plotting the offensive and defensive performance of the league's 32 teams. It's nothing too complicated—basically a NYMag Approval Matrix for football—but it reveals a lot about the state of the NFL through Week 5....
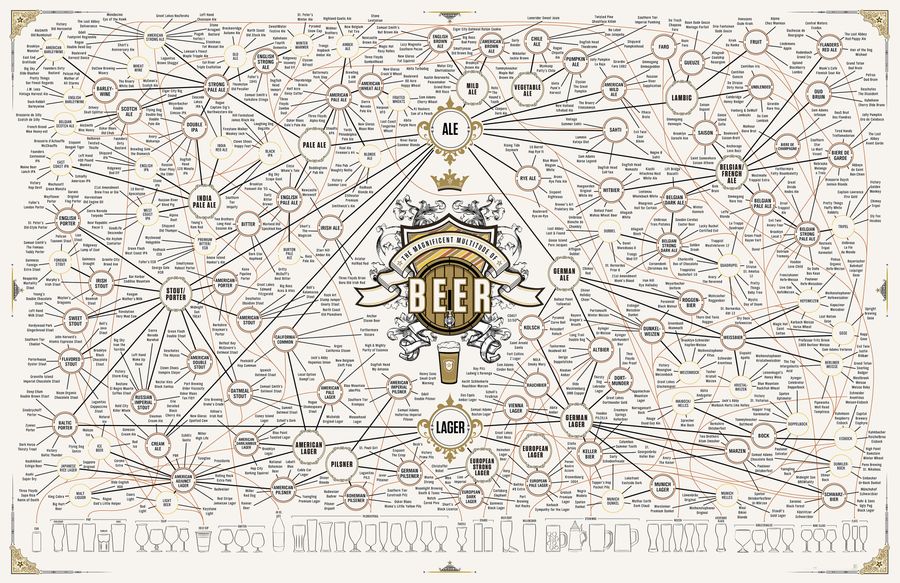
The Taxonomy Of Brewing: 500 Beers On One Ridiculous Chart
Updating their 2010 and 2011 offerings, Pop Chart Lab has released "The Magnificent Multitude of Beer," a 60'' x 40'' print/chart detailing dozens of brewing styles and sub-styles, as well as over 500 individual beers (click here for a larger version)....

Infographic Of Mariano Rivera's Career
The most talented Craig Robinson looks at Mariano Rivera's career....
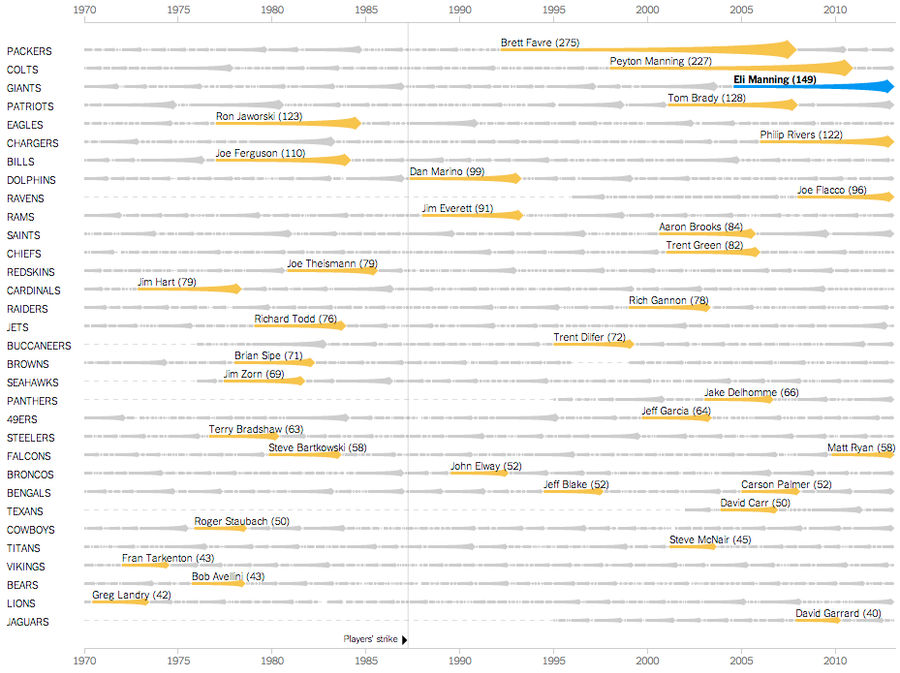
Chart: Eli Manning Has Started 150 Consecutive Games; We Are Old
Eli Manning made his 150th consecutive start for the Giants this Sunday, completing 18 of 37 passes for 217 yards, one touchdown, and one interception. The excellent New York Times graphics team has put Manning's feat of longevity into historical context, creating an interactive chart that chronicle...

Infographics: Which NFL Teams Are This Season's Biggest Road Draws?
With the NFL season set to kick off in mere hours, Vivid Seats has released data on which teams are the best and worst road draws–in terms of ticket prices–for the 2013 season. The Broncos come out on top, increasing ticket prices by an average of 53.7 percent when on the road. While Denver has abov...

Infographic Compares NBA Scoring With Hip Hop Name-Dropping
If you enjoy hip hop and the NBA, then you definitely need to spend some time playing with bdon.org's fancy new infographic. The concept is simple: see how various NBA players' season-by-season scoring numbers stack up against their yearly mentions in hip hop songs....

NBA Finals Elimination Games, Ranked According To Fun
Note: An earlier version of this post was missing two key elimination games – 1988 Game 7 and 1993 Game 6 – which are now included in the rankings....

Map: Do You Live In IHOP America Or Waffle House America?
America might be a fast-food nation, but at least it's a rich, greasy tapestry of fast food. In-N-Out Burger is the jewel of the West Coast. Massachusetts seems to breed Dunkin' Donuts franchises the way it used to breed Kennedys. Oklahoma and Wyoming are the only states to have both Hardee's and Ca...
Infographic: Where Do NFL Draft Picks Come From?
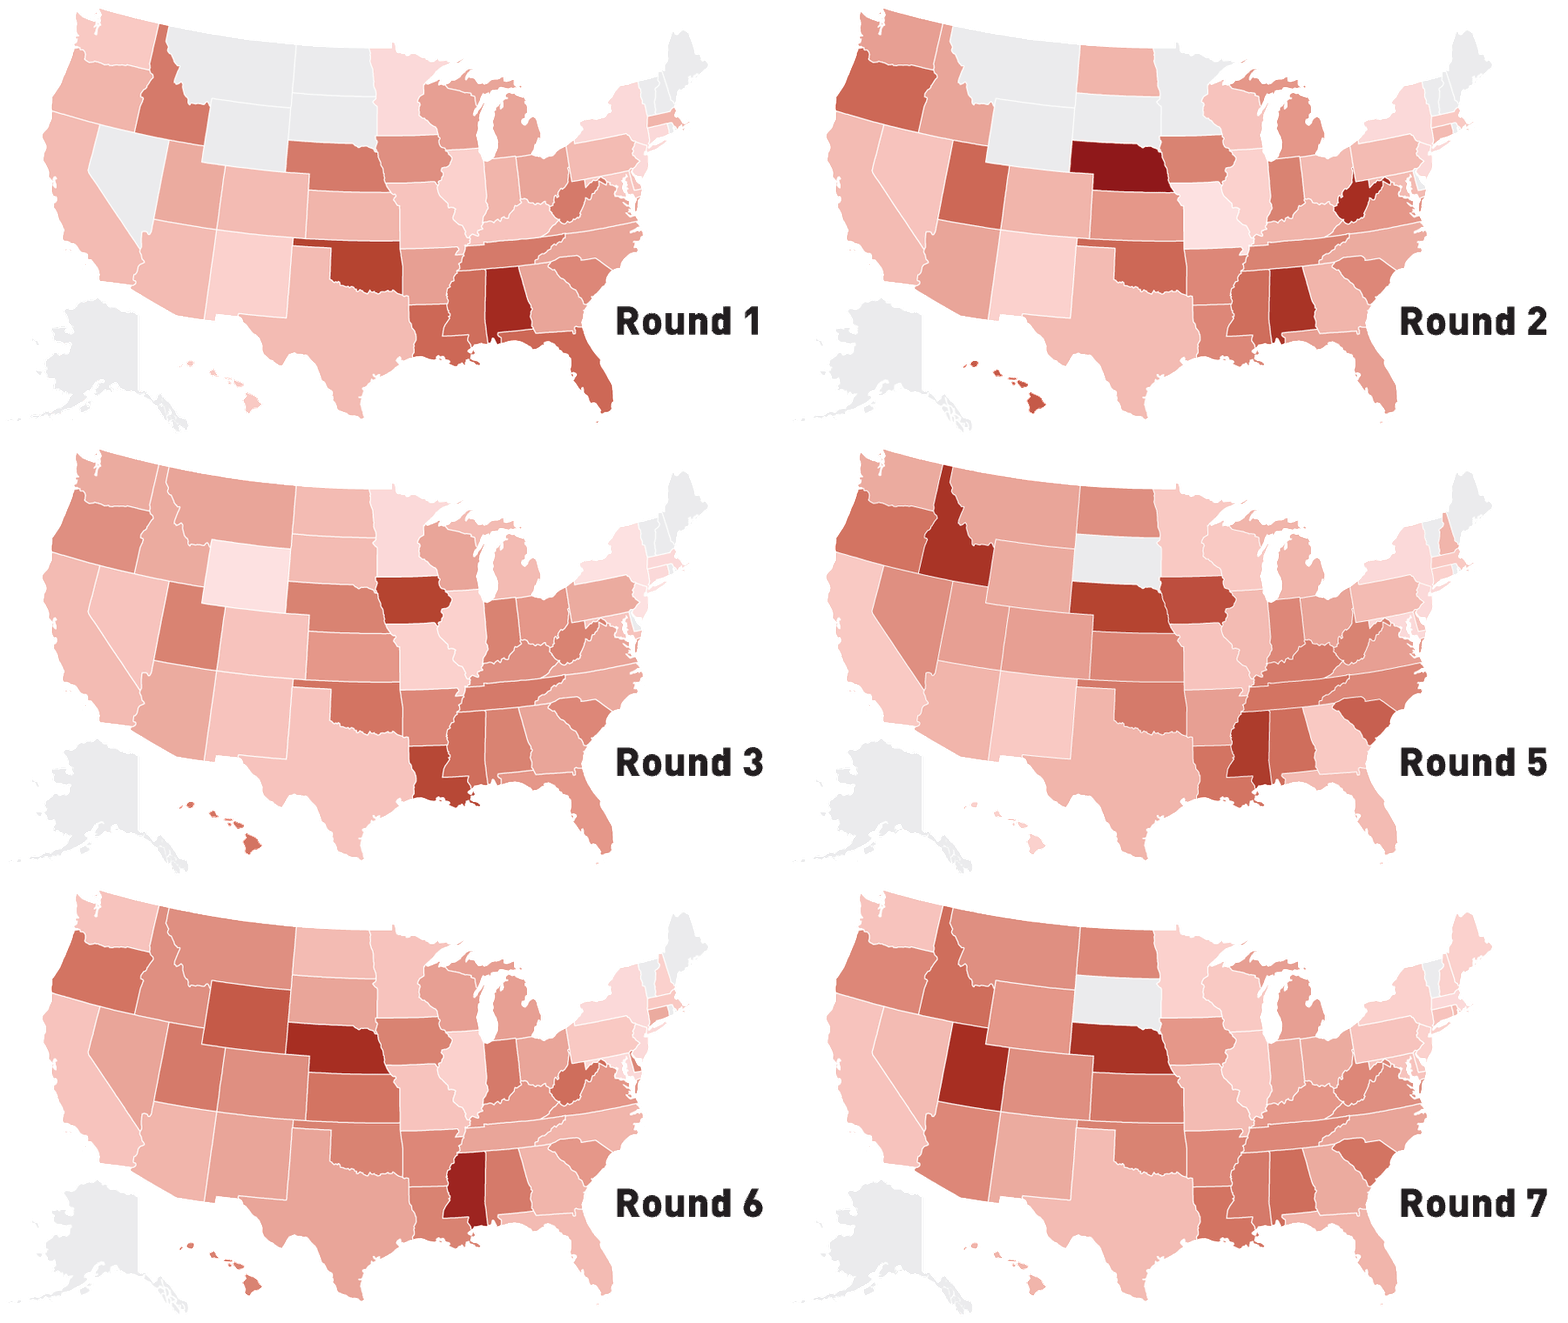
Tonight, we get to watch the first round of one of the saddest NFL drafts in recent memory, with teams tripping over each other trying to trade down in a weak year. Even in the good years, success in the college game doesn't always translate to the pros, but some regions and conferences have a reput...
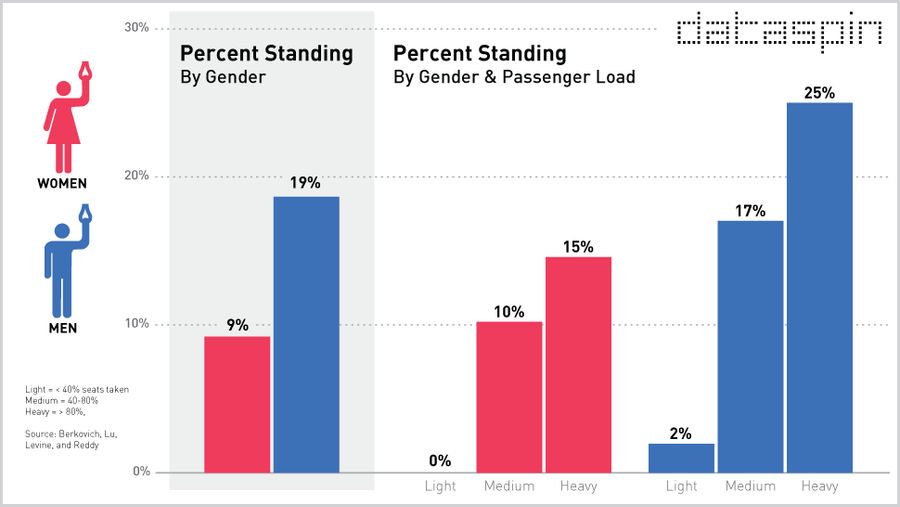
Are Men More Likely To Stand On The Subway Than Women?
Welcome to Dataspin, a weekly data visualization of whatever the fuck....
Animated Infographic: Watch As America's Stadiums Pile Up On The Backs Of Taxpayers Through The Years
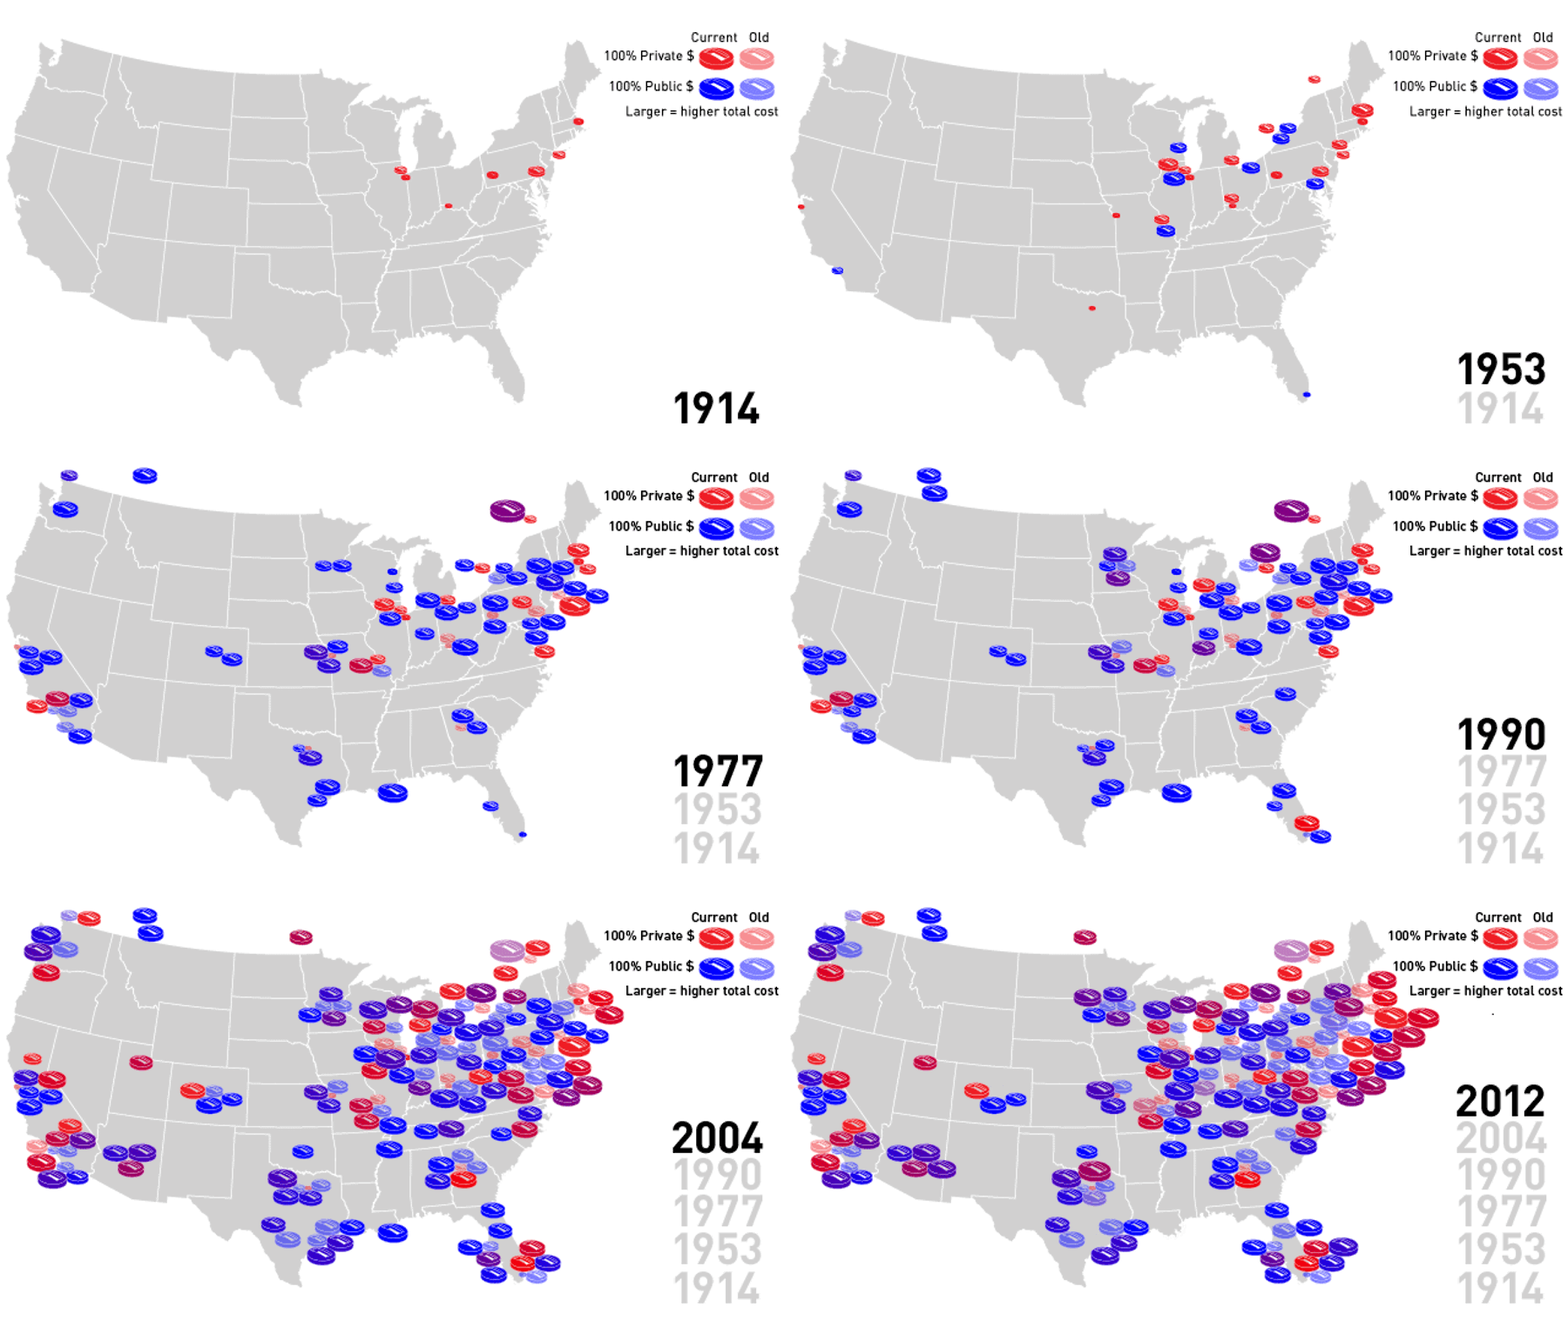
When Jeffrey Loria decided to once again blow up his Marlins, it sparked a brief outrage over the $500 million in public money that had been spent on the team's brand new stadium. These outrages happen every couple years or so and are forgotten in time for the next bond issue. Public financing of st...
Every U.S. Sports Championship, In Convenient Infographic Form
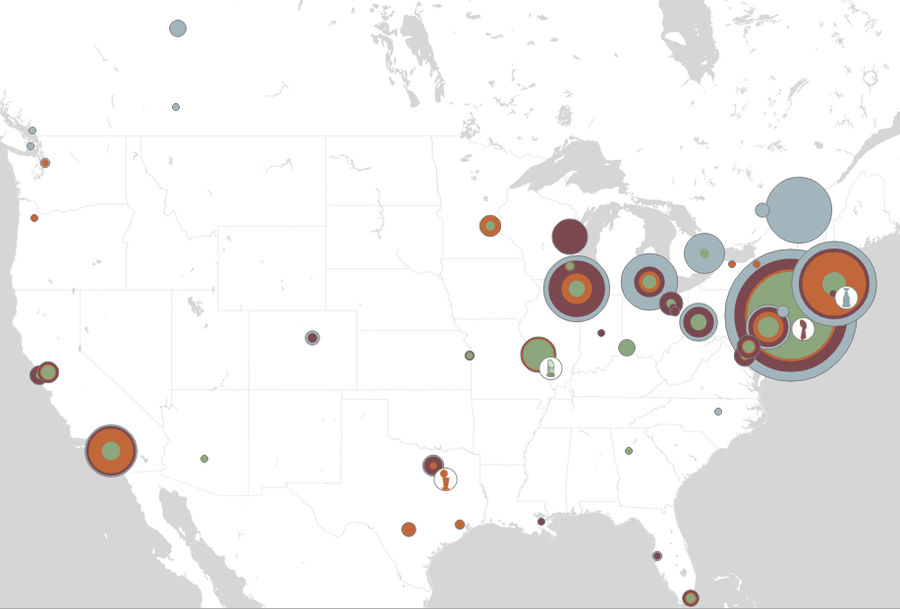
Our friends at Slate have created a slick infographic that lets you use a sliding bar to see the year-by-year chronology of every championship won in the four major professional sports. Click any given city and a stat box appears listing each championship, when it was won, and the percentage of the ...

The Prettiest, Most Rigorous Examination Of Bobblehead Giveaways You'll See
The great Craig Robinson of Flip Flop Fly Ball has produced the graphic you're looking at, from which you learn, among other things, that the Brewers hate their current roster, and the Marlins are cheap bastards. Click to enlarge. [Flipflopflyin.com]...