
Chart: Scoring At The 2014 World Cup Has Been Bonkers

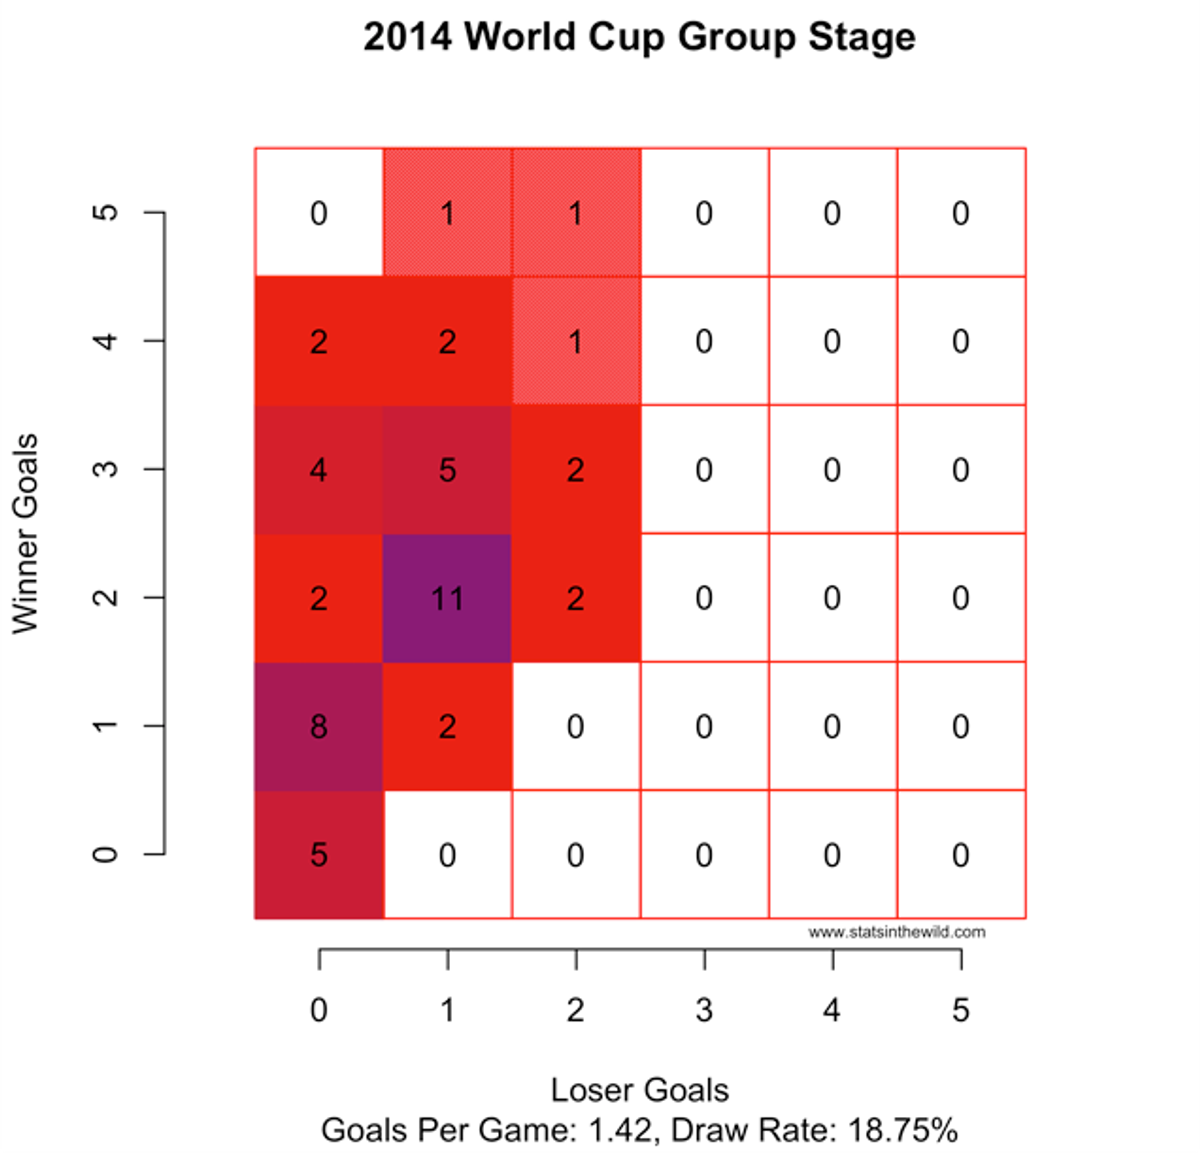
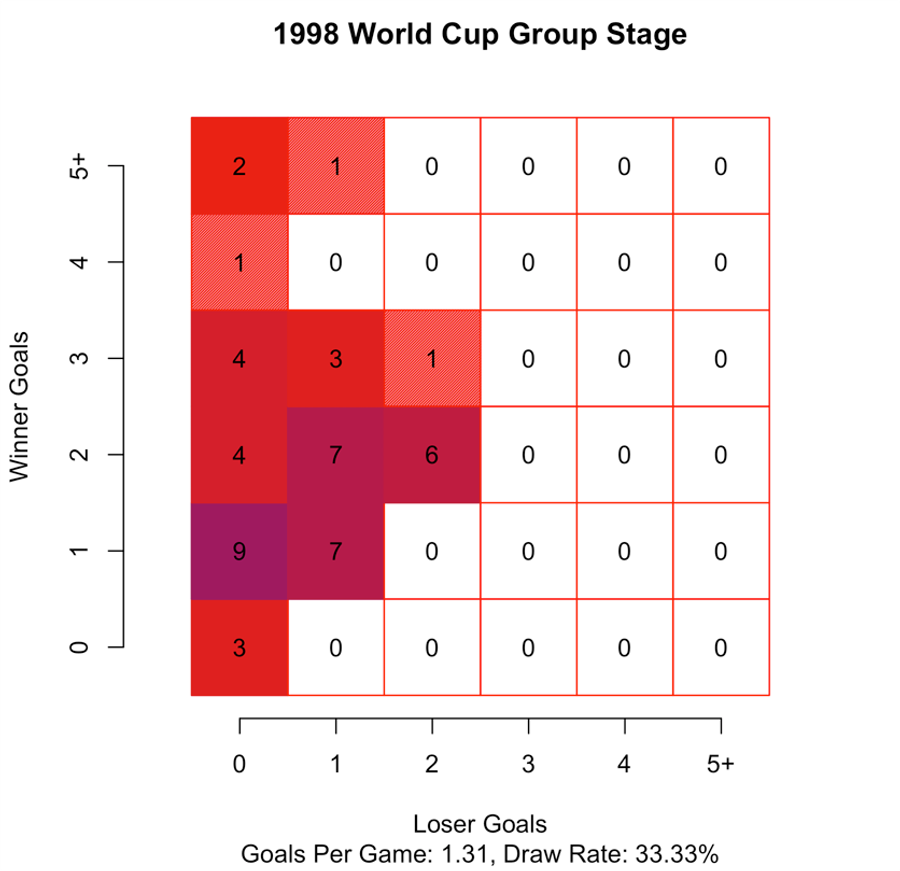
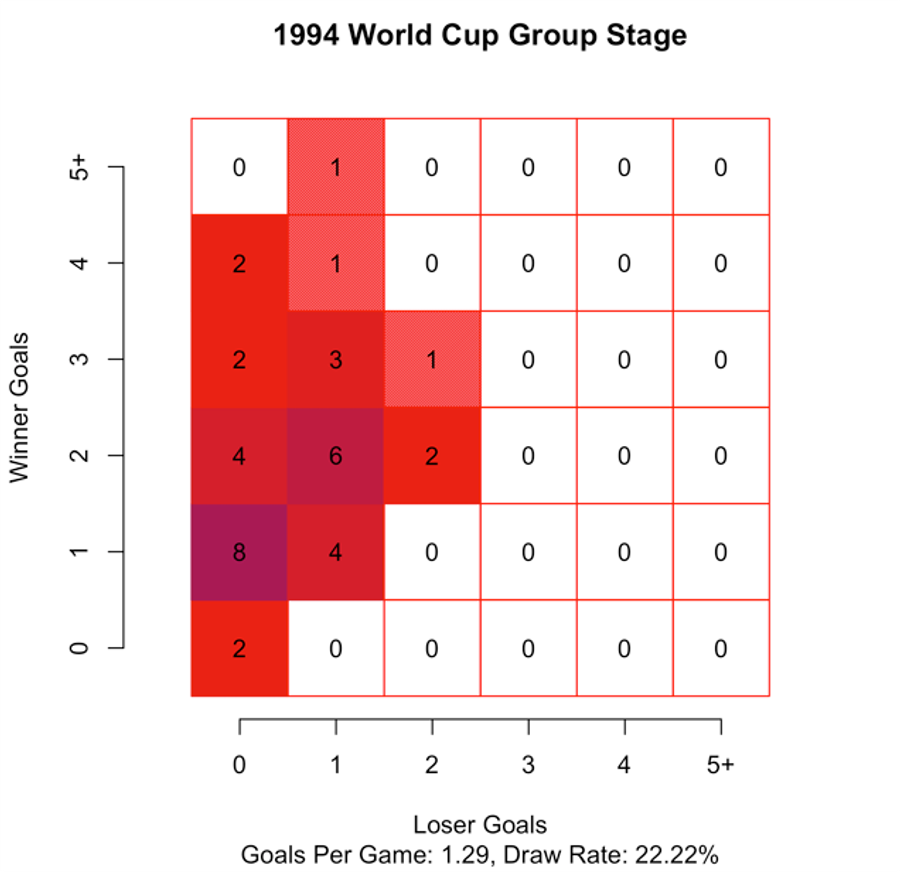
Over on Stats In the Wild, Gregory Matthews has visualized how much scoring there's been at the 2014 World Cup, using the clever grid chart you see above. The goals of the "winning" team—draws are included—are the y-axix, and the losing team is the x-axis. Each square is labeled (and colored) with the number of times that particular outcome occurred; the most common outcome, a 2-1 win, occurred in eleven games.
On average, there were 1.42 goals per game per team in the 2014 group stage, the highest figure in the last six World Cups. Only 19 percent of games ended in a draw, the lowest figure over the last six Cups. To compare, the average NFL team scored 2.61 touchdowns per game last season, and five teams—the Bucs, Ravens, Texans, Jets, and Jaguars—scored fewer than two.
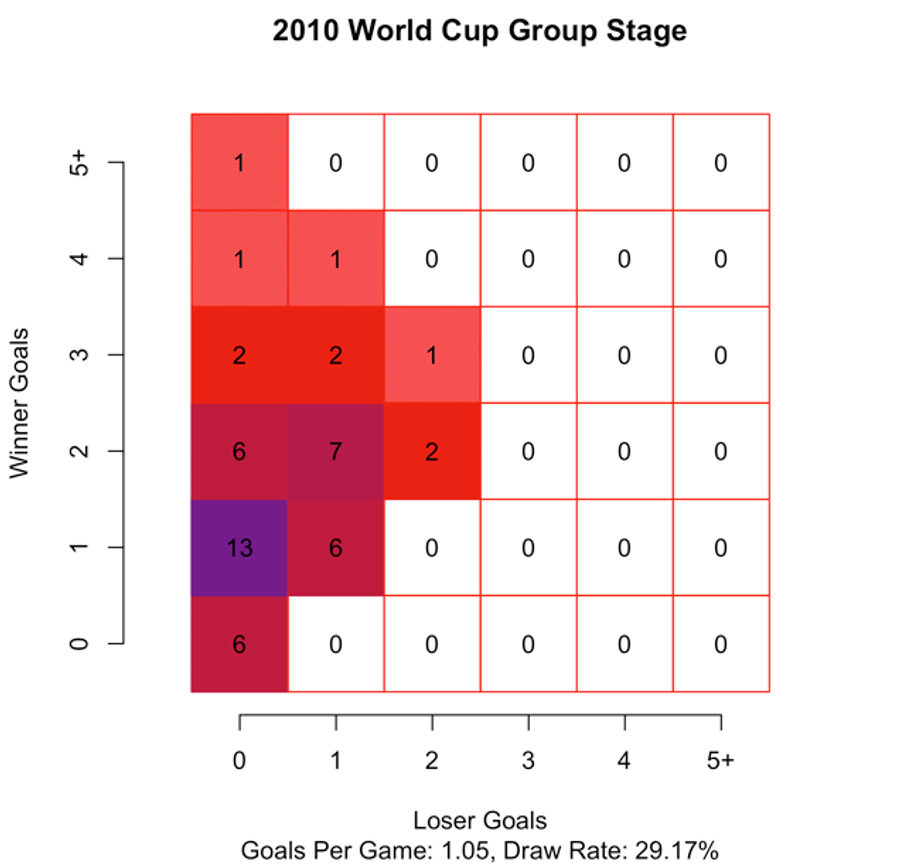
Here's the chart for 2010, which was particularly low-scoring:
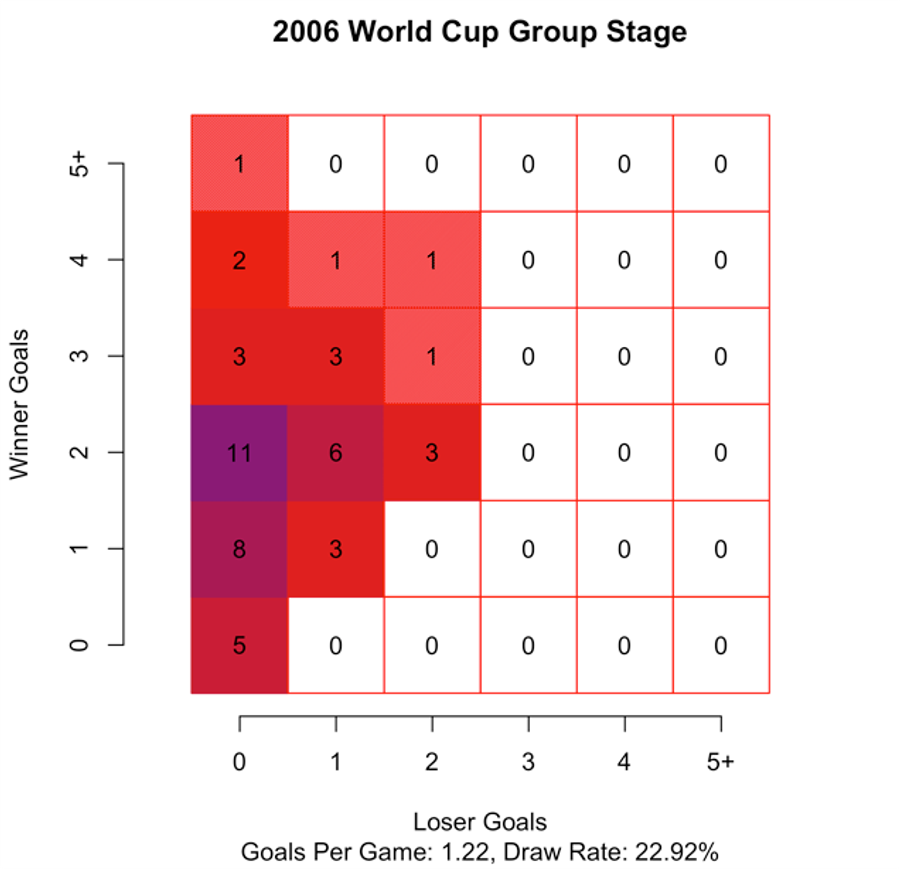
Here's 2006:
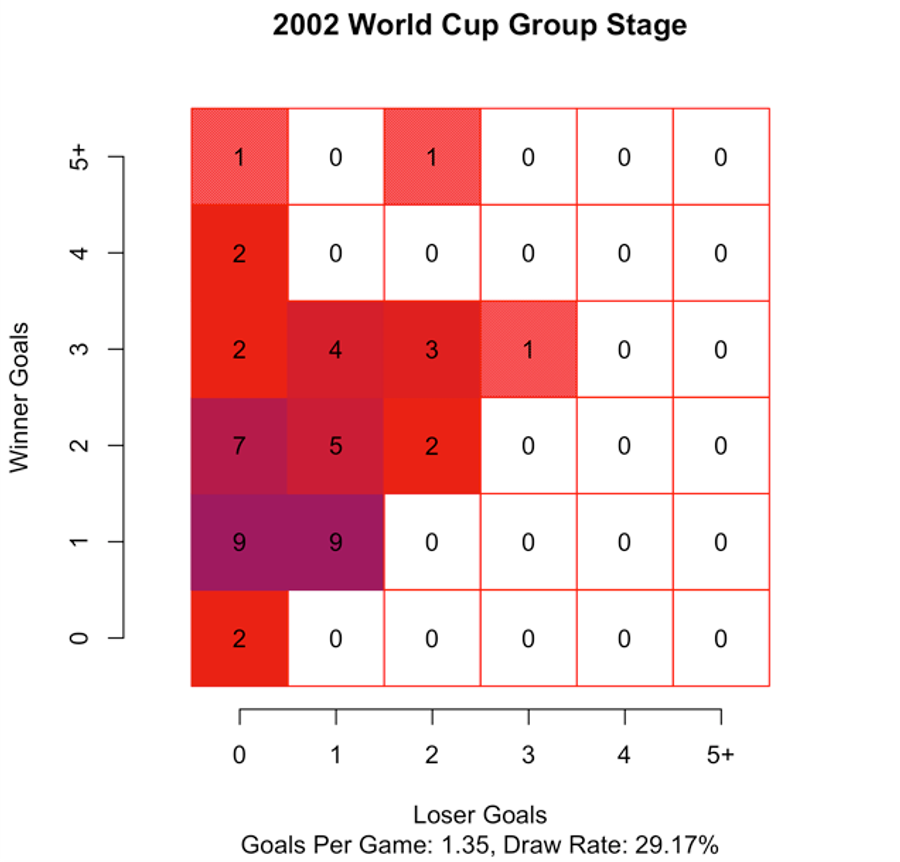
2002:
1998:
And here's 1994, which had 12 fewer matches:
Related


What Prediction Markets Are Telling Us About NFL 2026 MVP

The Sacramento Kings Need to Blow It Up Before It's Too Late


Ben Askren Didn't Win the Match—But He Won the Weekend

- UFC Fight Night Best Betting Picks for Du Plessis vs. Usman in OKC
- France vs. England Best Bets: Three Picks for the World Cup Third-Place Match
- Dodgers vs. Yankees Friday July 17 Best Betting Picks and Props
- July 17 White Sox vs. Blue Jays Prediction, Odds and Best Bets
- Three MLB Futures Bets to Make After the All-Star Break
- Three Heisman Trophy Sleepers Worth Betting Before the 2026 Season
- England vs. Argentina Best Bets: Three Picks for the World Cup Semifinal
