Fewer Threes, More Post: How LeBron James Completely Overhauled His Playoff Game

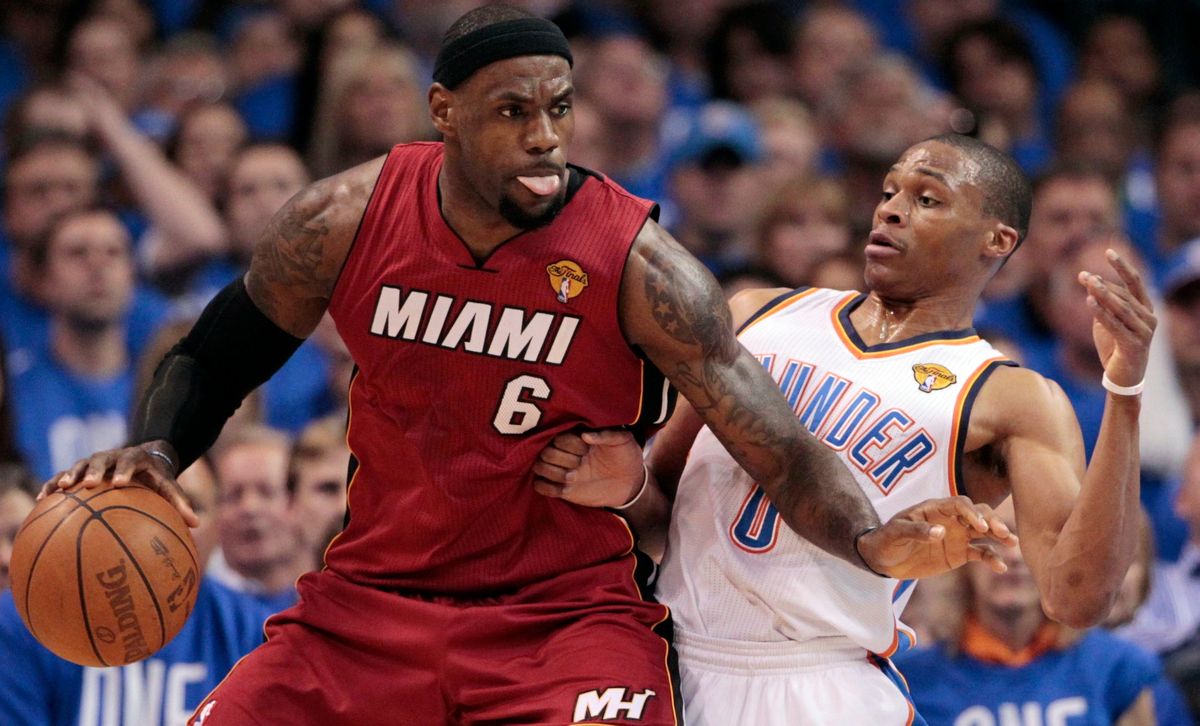
Unlike last year, LeBron James dominated the 2012 playoffs like the best basketball player in the world. We asked Kirk Goldsberry, of the indispensable CourtVision, what was different about James's postseason play this time around.
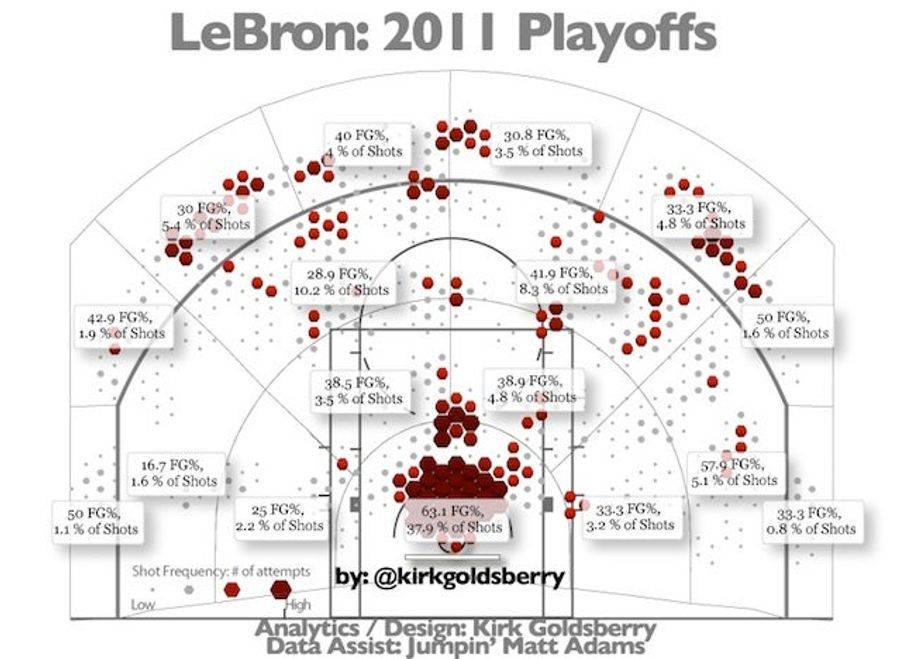
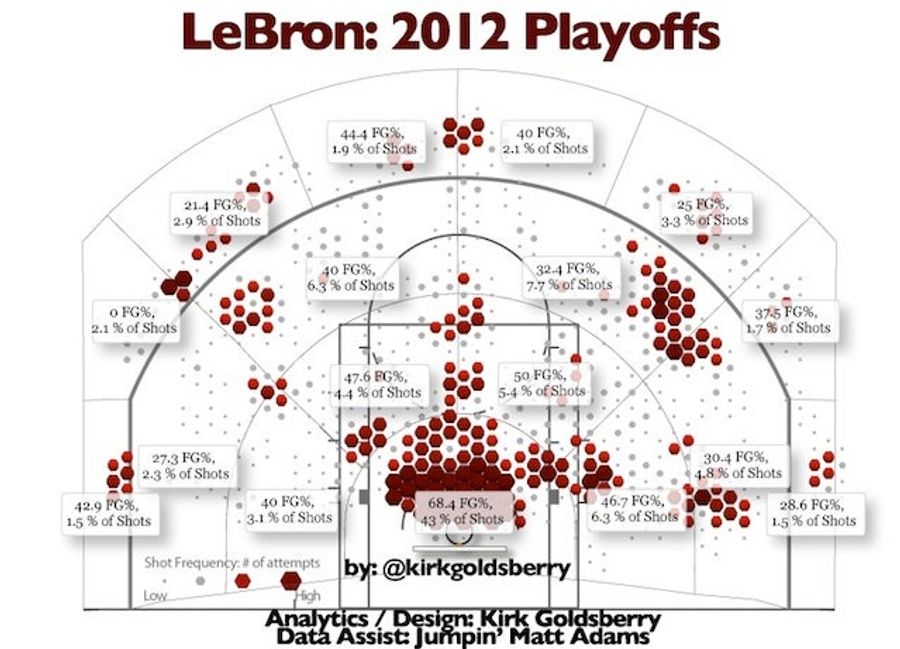
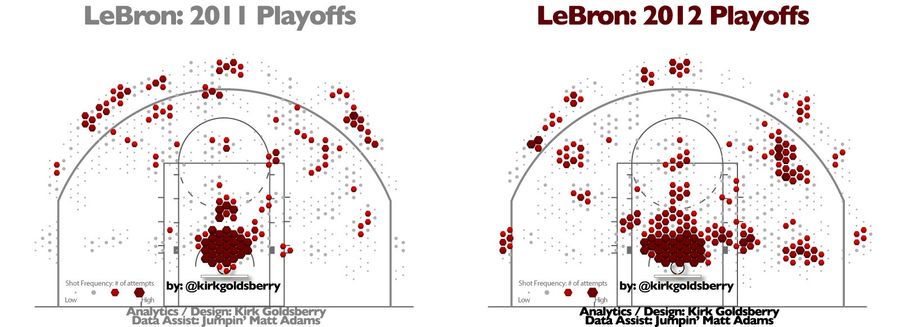
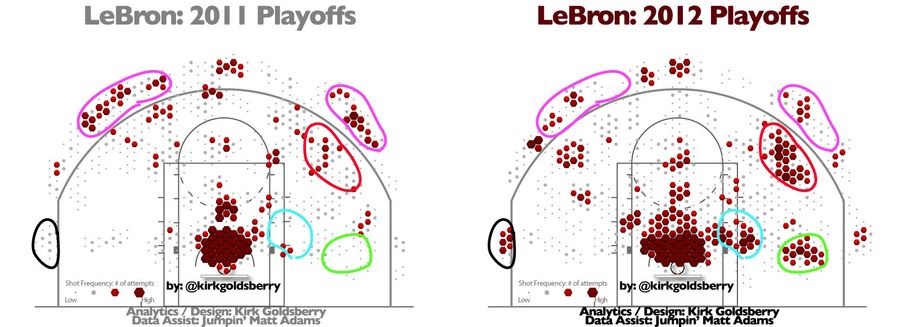
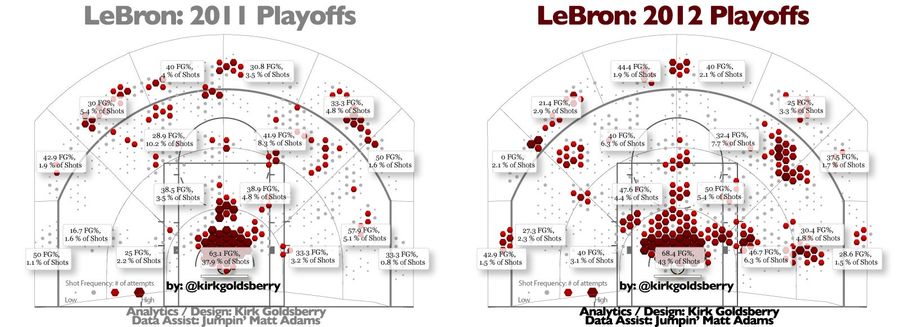
These are LeBron's 2011 and 2012 playoff shot charts, labeled with field goal percentage from each of 17 zones on the court. Side-by-side comparisons, along with annotated versions, can be found at the bottom of the post.
Here are three changes LeBron made to his game since last year, which show up clear as day on the charts:
1.) LeBron was more active near the rim and in the post in the 2012 playoffs. Forty-three percent of his field goal attempts were close-range attempts this year; last year that number was 38 percent. His newfound post game is evident in the charts, especially on his left.
2.) He was not only more active near the rim, he was more efficient. He shot 68 percent in close-range situations this year, up from 63 percent last year. I think his post-up game is one big reason. He was better with his back to the basket this year, which means better looks near the rim.
3.) LeBron shot fewer threes during these playoffs. Last year 23 percent of his field goal attempts occured beyond the arc. This year that number was 17 percent. Essentially, the 2012 LeBron replaced these extra three-point attempts with close-range shots, which is important for a few reasons.
He was Miami's best scorer near the rim.
He was not Miami's best three-point shooter, but he was Miami's best passer. When he penetrated it forced defenses to collapse around him, creating options for better distance shooters like Shane Battier, Mike Miller, and Mario Chalmers. A notably high percentage of his assists these playoffs led to three-point baskets.
He was Miami's best rebounder. LeBron being close to the rim improved Miami's overall rebounding presence.
The differences are even more startling when you compare LeBron's shot selection from 2006-2011 to his 2012 chart.
Click the charts to expand:
Kirk Goldsberry examines the NBA using spatial and visual analytics. He publishes some of his work at courtvisionanalytics.com, and you can follow him on Twitter at @kirkgoldsberry. Matt Adams is a spatial analyst living in New York City, who helped out on this study.

Ole Miss' CFP Hopes Take a Hit After Loss to Texas
Why Tyrese Maxey Is the Key to the Sixers’ Success
Seahawks vs. Chiefs Betting Pick: SNF Best Bets
Why Did Netflix Mike Tyson Docuseries Omit His Last Fight?
- Rays vs. Brewers Prediction: Why Tampa Bay Can Steal Game 2 on the Road
- UFC 333 Betting Lines Are Tightening Across a Wide-Open Fight Card
- UFC 333 Betting Splits: Where the Sharp Money Is Landing This Weekend
- NBA Best Bets Today: Pacers, Grizzlies and Trail Blazers Picks
- College Football Week 8 Best Betting Picks, Predictions
- World Series Game 1 Predictions: Rays vs. Brewers Picks and Best Bets
- UFC 333 Predictions: Best Bets for Volkov, Keita and Murzakanov