
Infographics: Where Does Your NFL Team's Offense Come From? (Week 14)

There are just four more weeks in the NFL season, so let's take a look in on how the offenses in the league are doing, and which positions have been most productive for them.
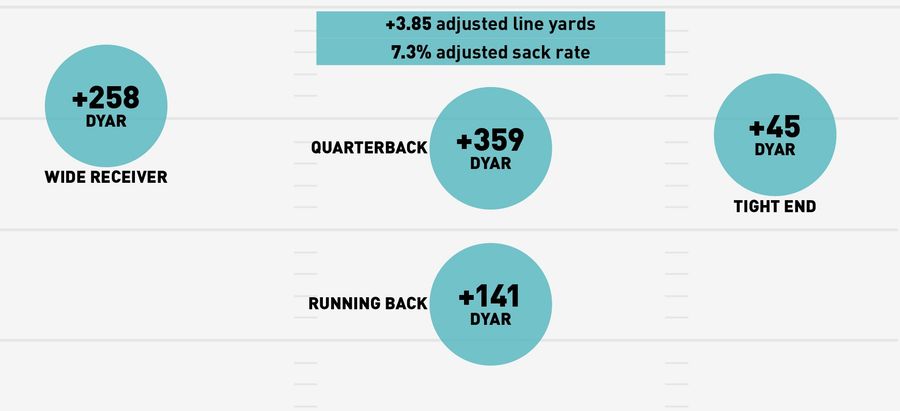
How These Work
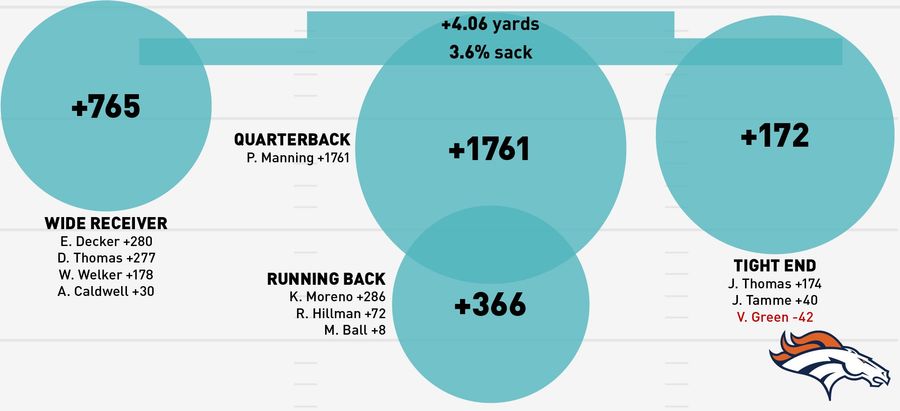
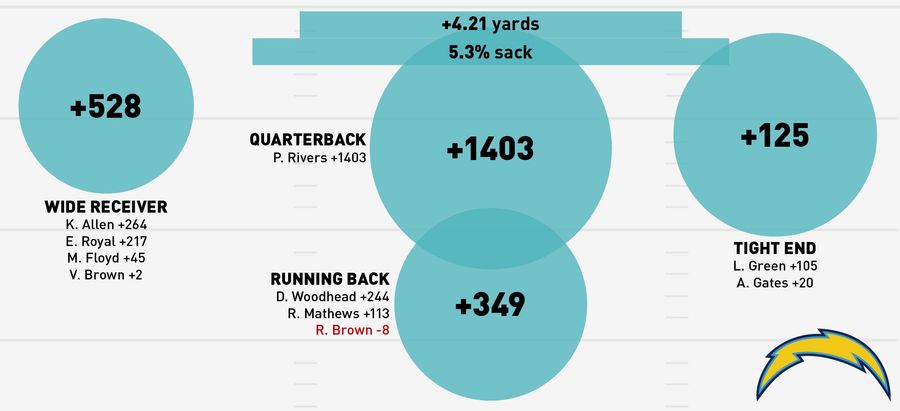
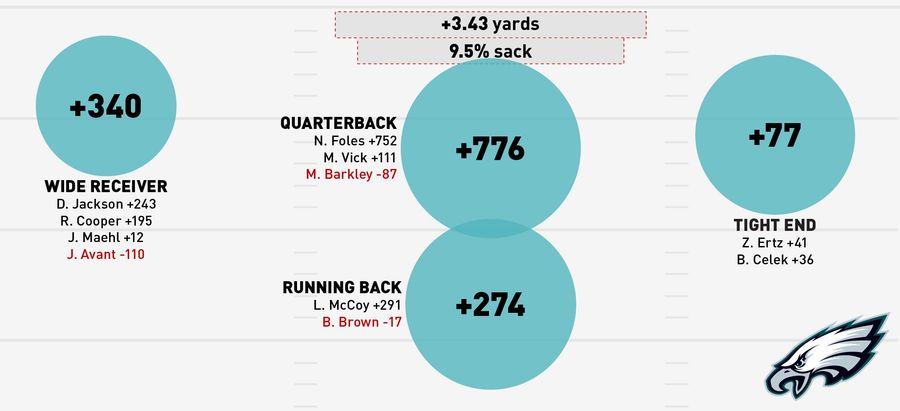
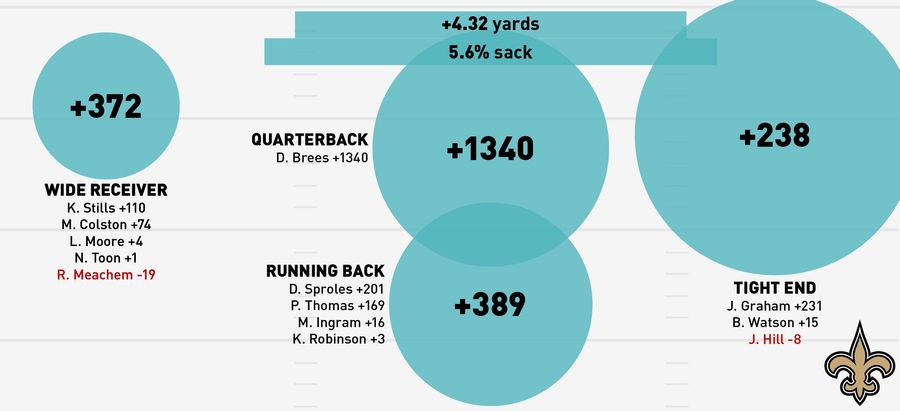
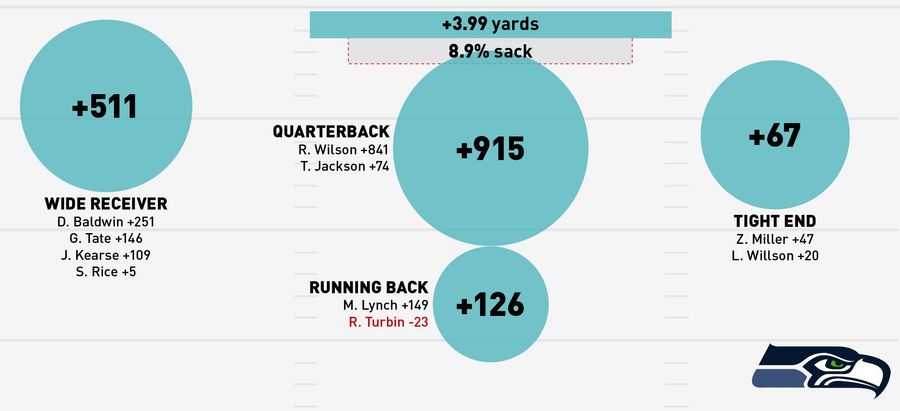
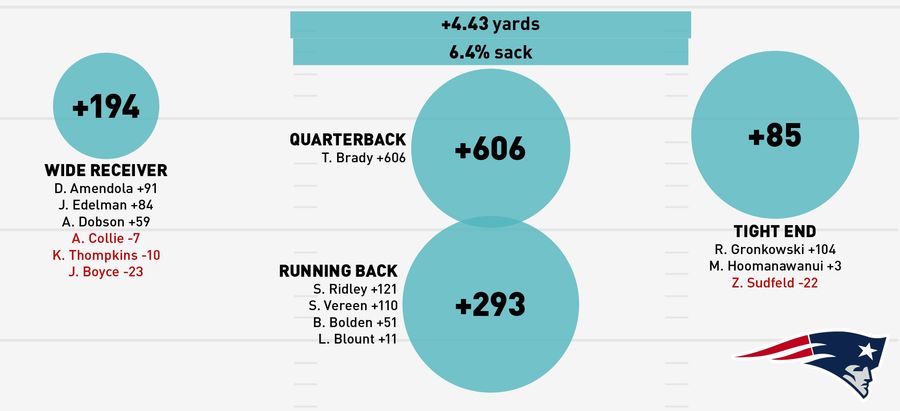
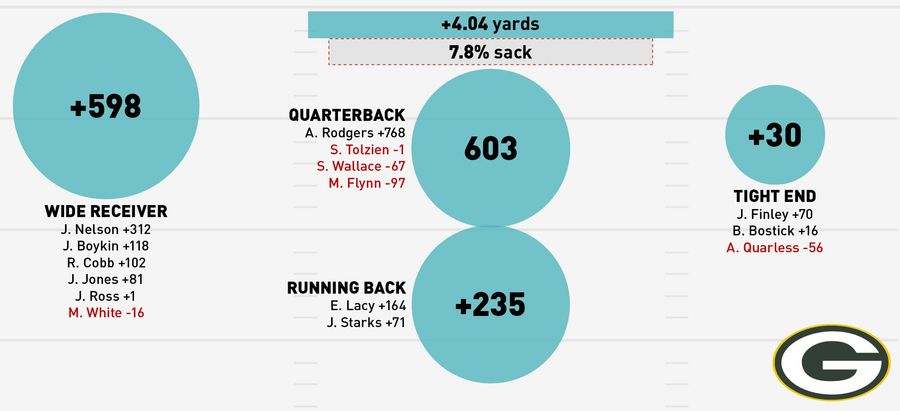
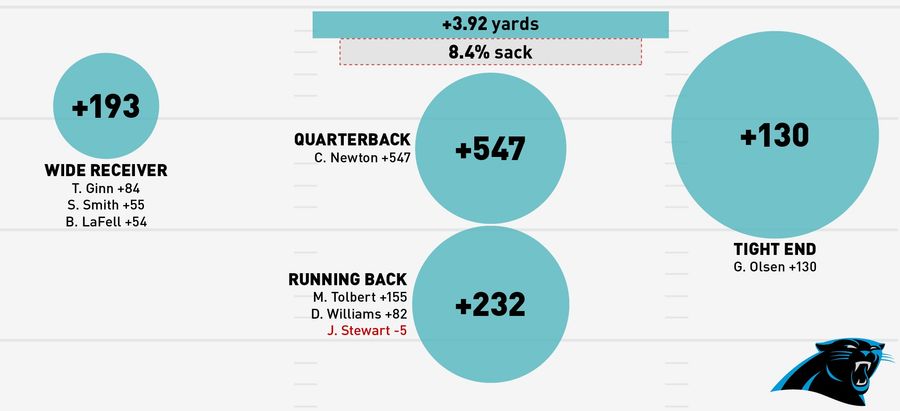
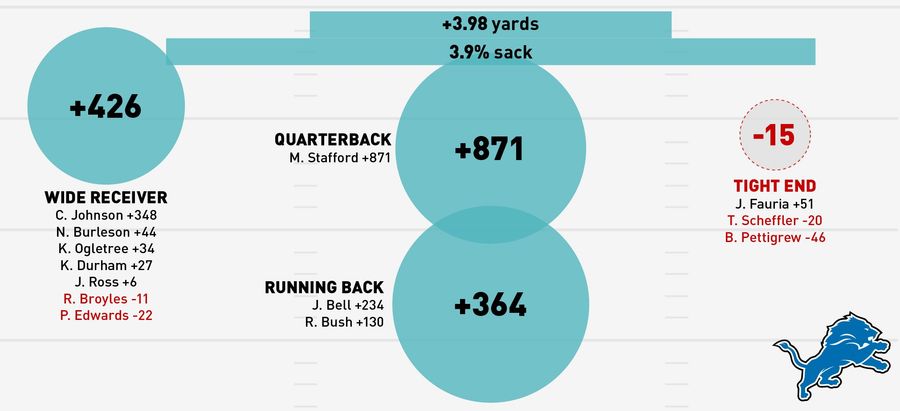
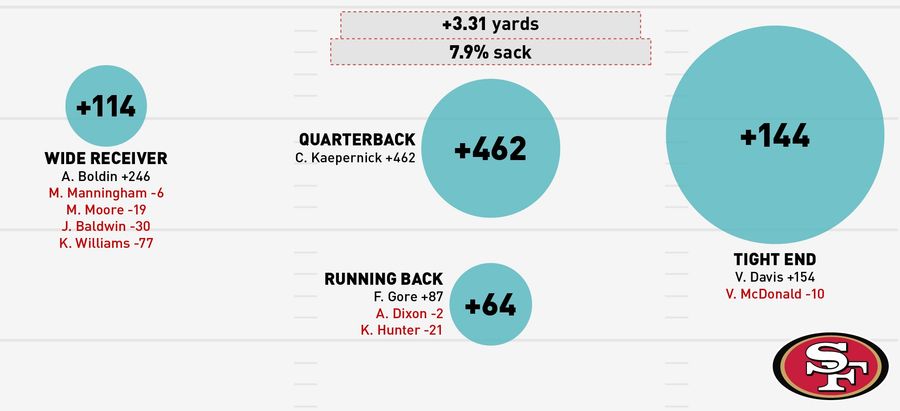
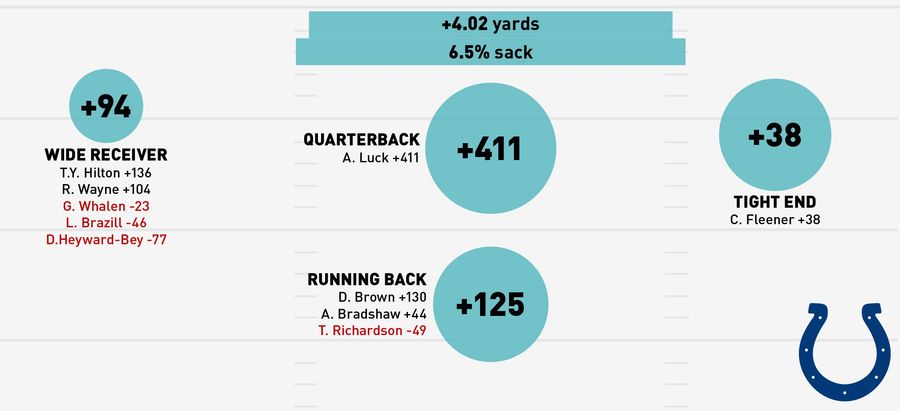
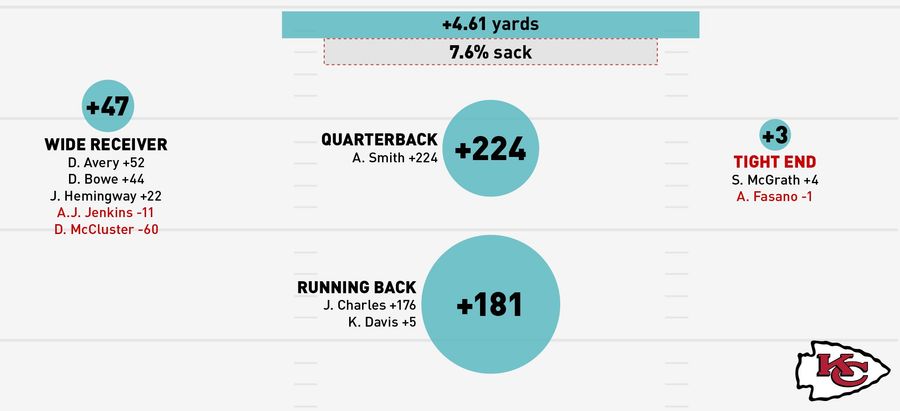
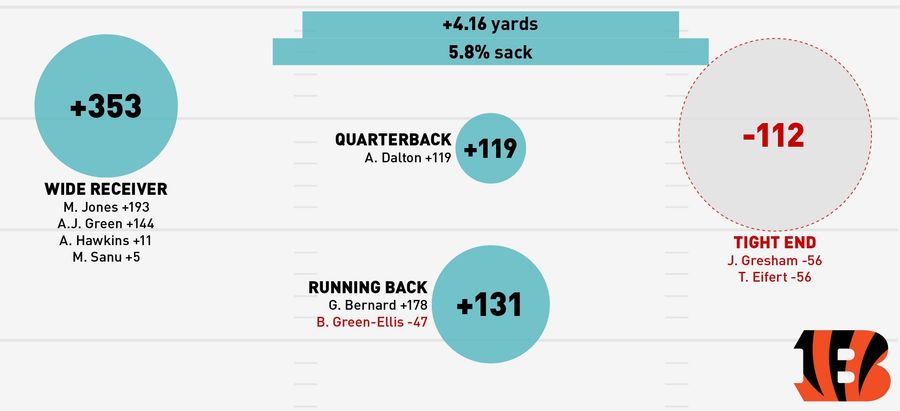
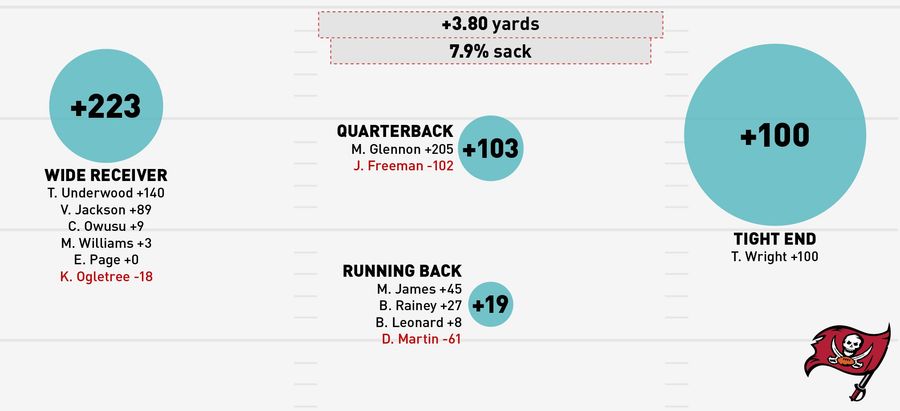
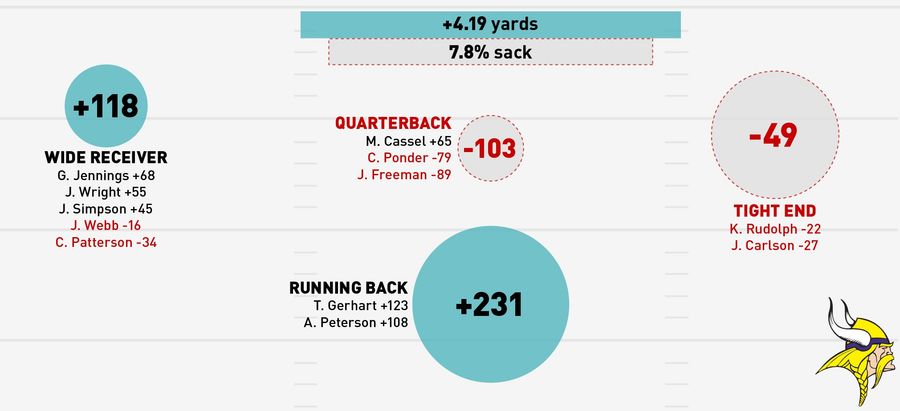
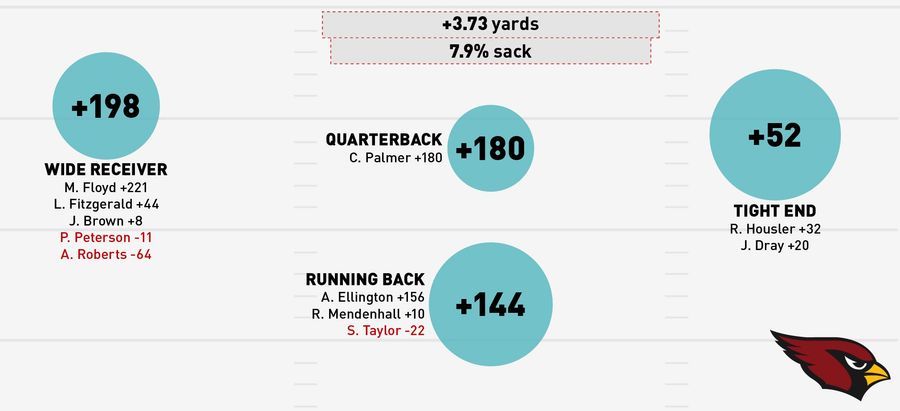
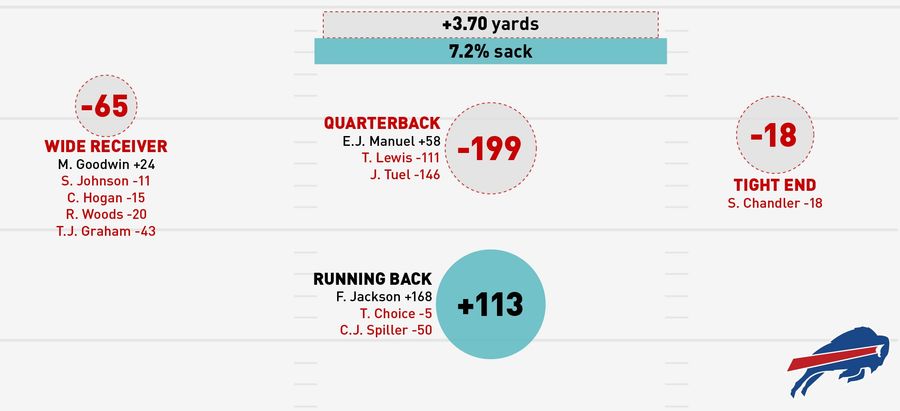
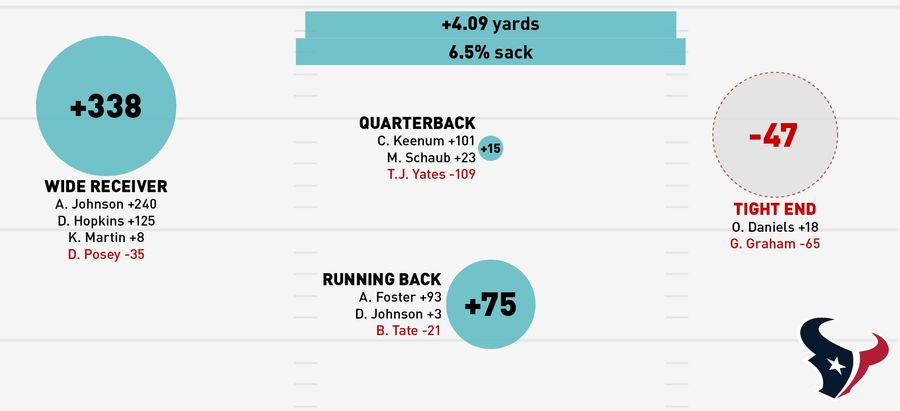
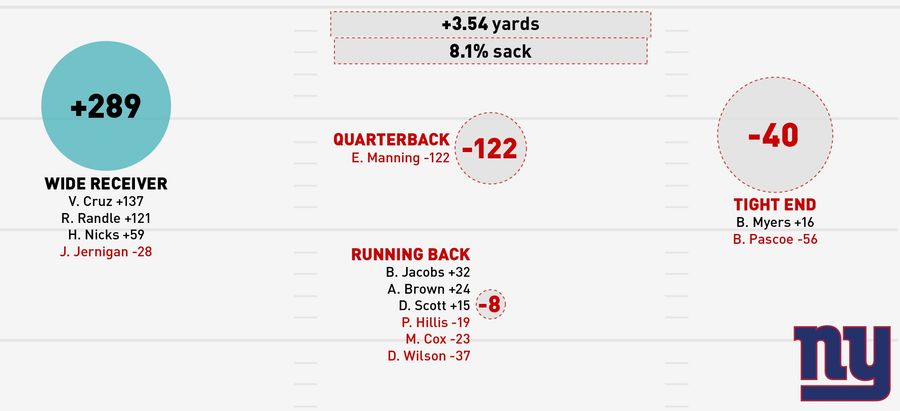
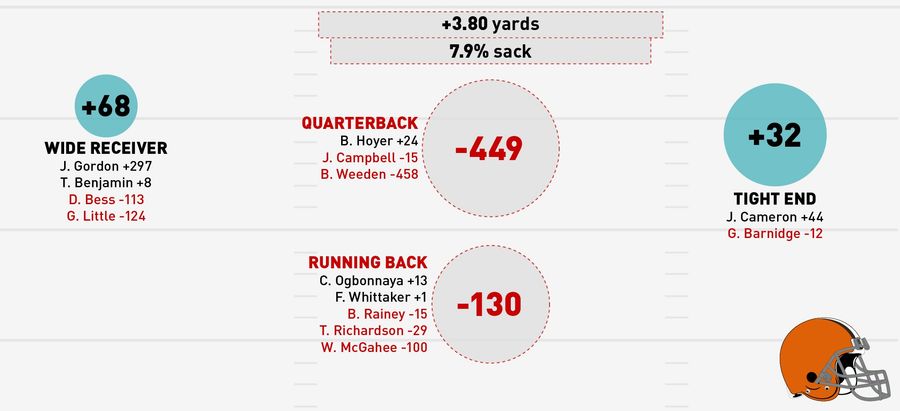
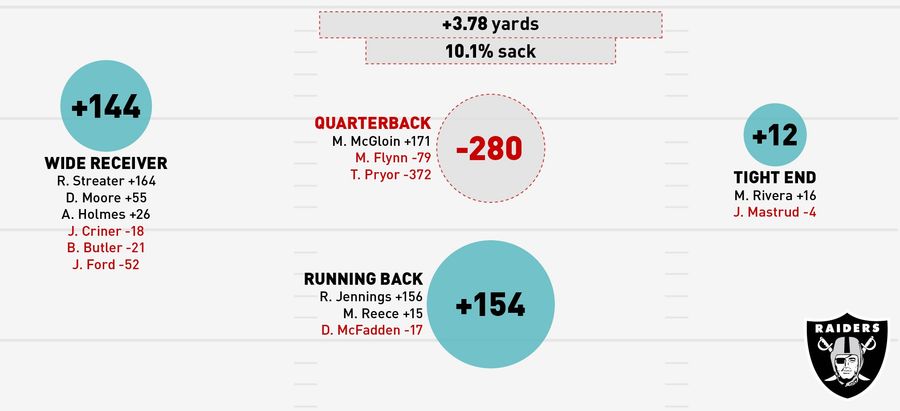
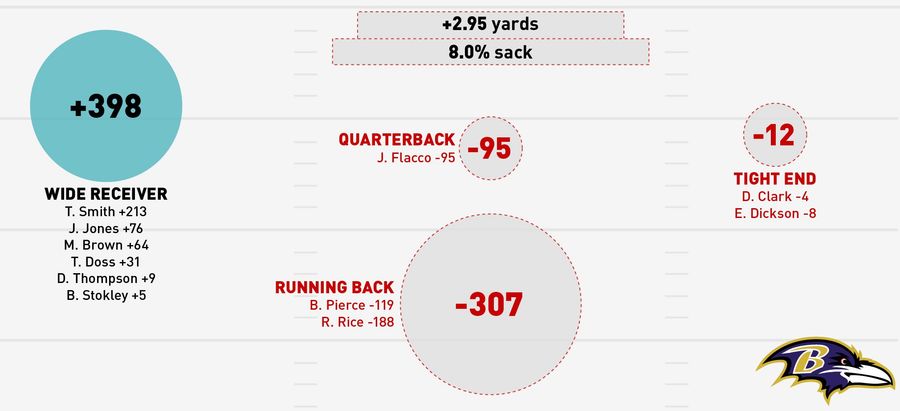
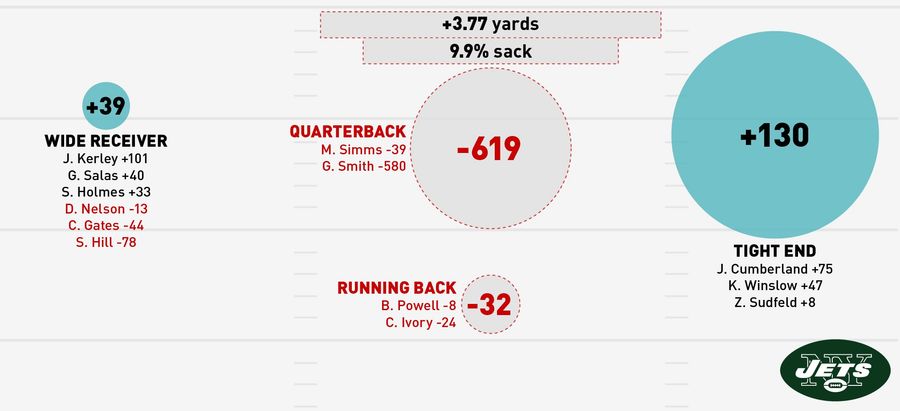
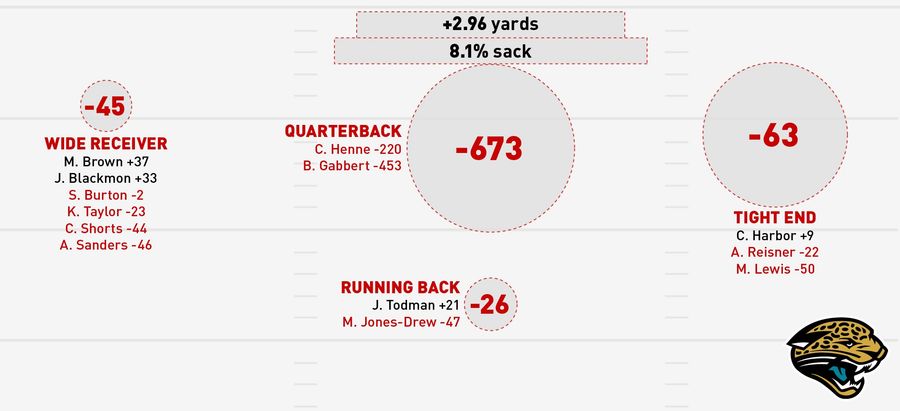
These charts are an update to the ones we did at the quarter and halfway points of the year. As usual, we're using Football Outsiders data to put these visualizations together. Each circle in these charts represents how productive that position has been for a given team. We added up every qualifying player's DYAR (explained below) at a given position—so you're not just looking at single players, but whole units. (Calvin Johnson finally took over as the best receiver in the league, but the Denver group is a better unit.) Bigger circles mean more production relative to the league average. Red circles mean below replacement level play. So, a big red circle means that that position really sucks.
If you're unfamiliar, DYAR stands for Defense-Adjusted Yards Above Replacement. It's a Football Outsiders metric that compiles the total value a player generates over the course of a year, and adjusts for the strength of opponents, instead of the slightly better known DVOA. (After week 10, the opponent adjustments are at full strength.) Broadly, we're using DYAR because we wanted to show how much production each team has gotten from each of its positions, not how well each player has played in whatever snaps he was on the field for. (DVOA is a rate stat, like the NBA's PER, meaning a highly productive five plays would set you ahead of league leaders. We aren't so interested in that here.)
A few takeaways:
The Patriots offense is finally coming around, with all its positions out of the negative, and all but wide receivers above league average.
It is very hard to have amass a lot of negative DYAR as a wide receiver—much harder than as a QB or running back, so the Cleveland combination of Davone Bess and Greg Little both going under -100 DYAR, and being the worst and second worst in the league, is quite the accomplishment.
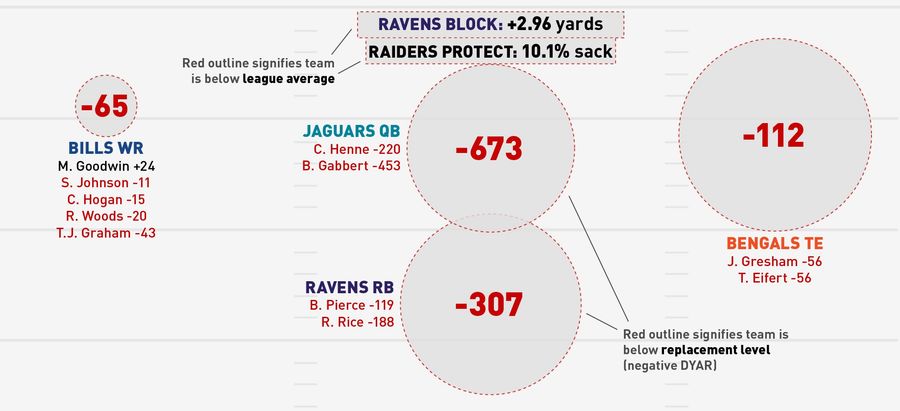
While it isn't quite as funny to have a "worst possible squad" made up entire of Jaguars units, it's refreshing to see a few other groups sneak into the mix.
Nick Foles, DeSean Jackson, and the rest of the Eagles have been on a tear since we did this at the halfway point, which is obvious enough, but it's come without slowing down LeSean's production. The Eagles are scary.
Andrew Luck's 411 DYAR puts him 15th among quarterbacks, but more than a third of that is from his rushing. He has 143 DYAR as a rusher, which puts him first among all QBs for rushing (Michael Vick is still #2).
Average NFL Team:
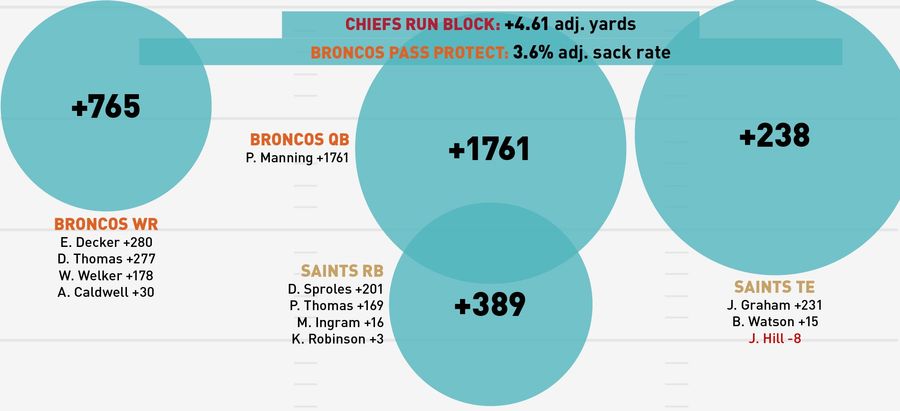
Best Squads:
Worst Squads:
1. Denver Broncos: +32.6% DVOA (Ranked 1 after Week 8)
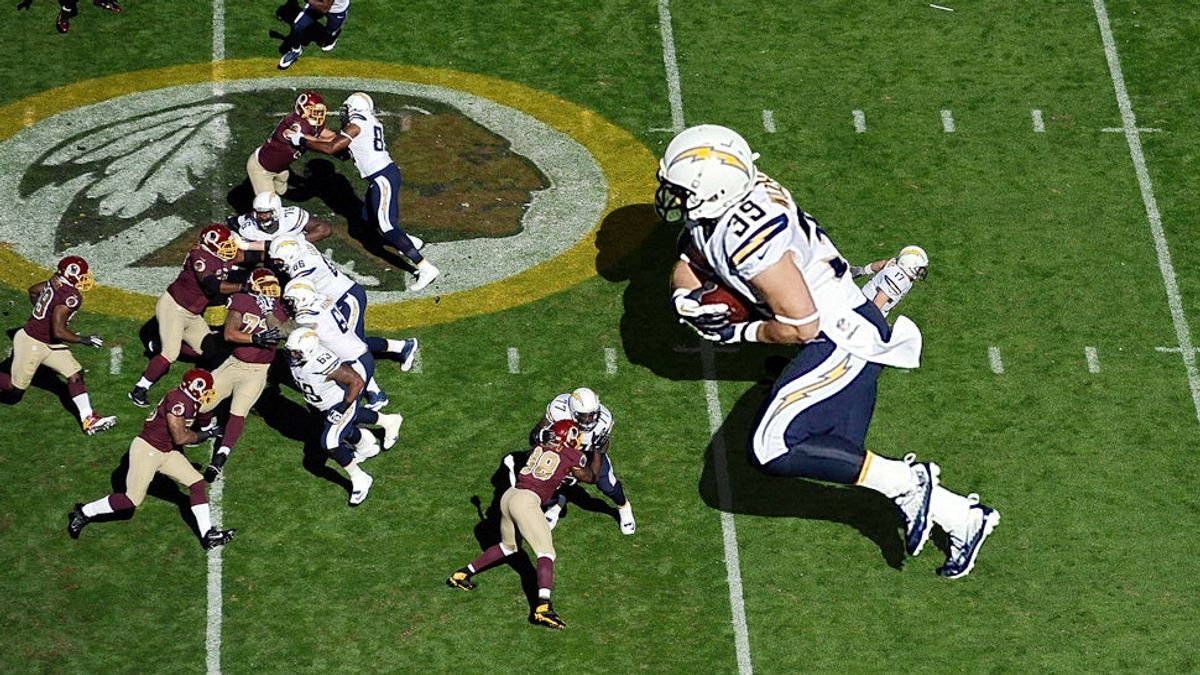
2. San Diego Chargers: +22.0% DVOA (Prev. 3)
3. Philadelphia: +18.2% DVOA (Prev. 13)
4. New Orleans Saints: +16.5% DVOA (Prev. 4)
5. Seattle Seahawks: +13.3% DVOA (Prev. 14)
6. New England Patriots: +11.8% DVOA (Prev. 20)
7. Green Bay Packers: +11.7% DVOA (Prev. 2)
8. Carolina Panthers: +11.4% DVOA (Prev. 9)
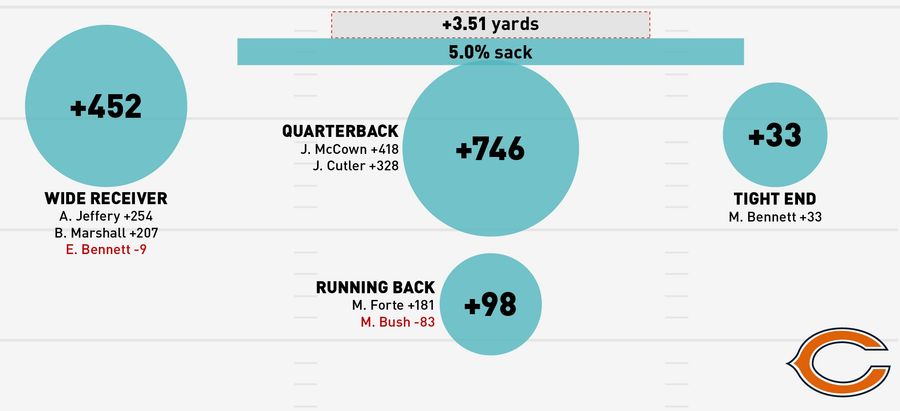
9. Chicago Bears: +11.0% DVOA (Prev. 7)
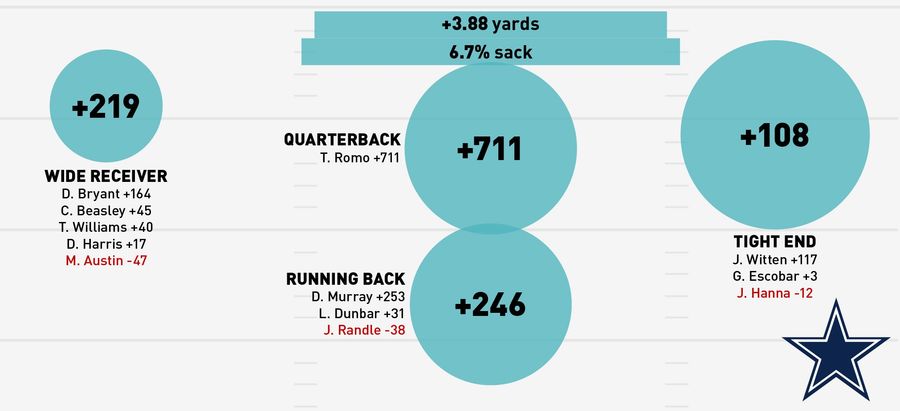
10. Dallas Cowboys: +7.9% DVOA (Prev. 12)
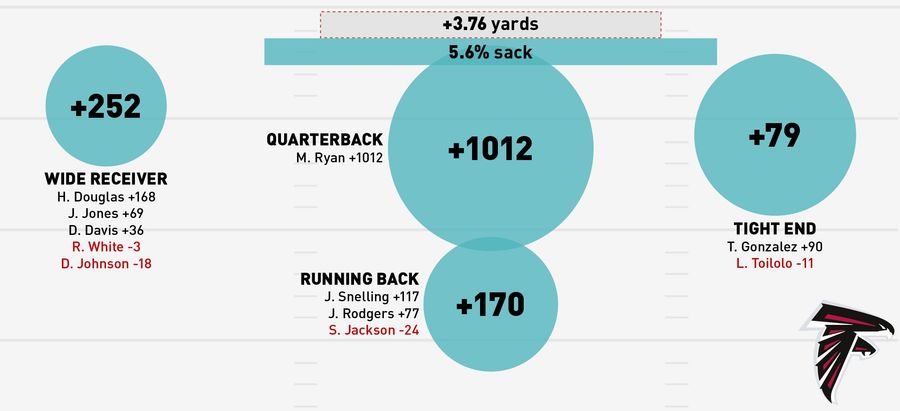
11. Atlanta Falcons: +6.0% DVOA (Prev. 10)
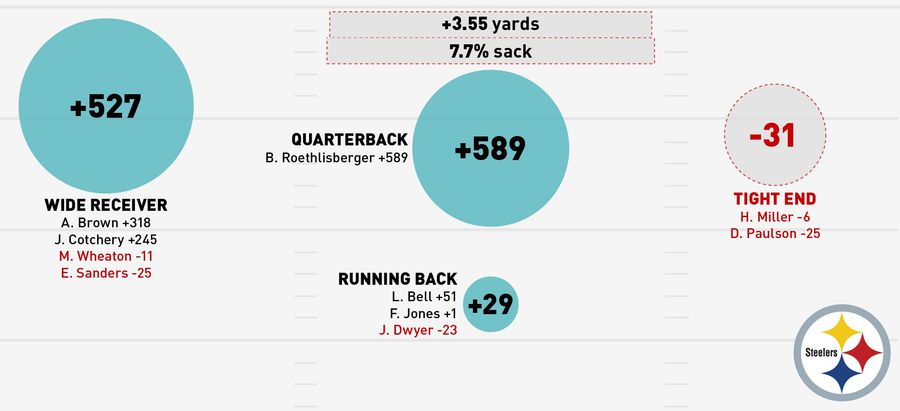
12. Pittsburgh Steelers: +5.7% DVOA (Prev. 17)
13. Detroit Lions: +5.4% DVOA (Prev. 8)
14. San Francisco 49ers: +5.1% DVOA (Prev. 6)
15. Indianapolis Colts: +3.8% DVOA (Prev. 5)
16. Kansas City Chiefs: -0.3% DVOA (Prev. 16)
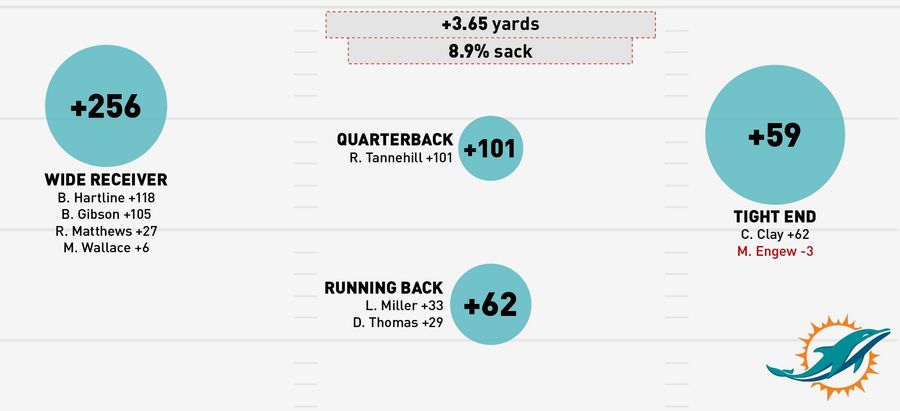
17. Miami Dolphins: -0.7% DVOA (Prev. 19)
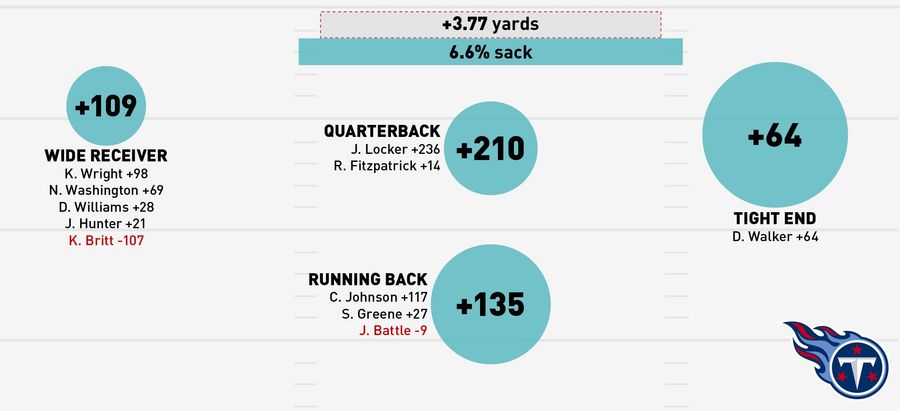
18. Tennessee Titans: -2.3% DVOA (Prev. 18)
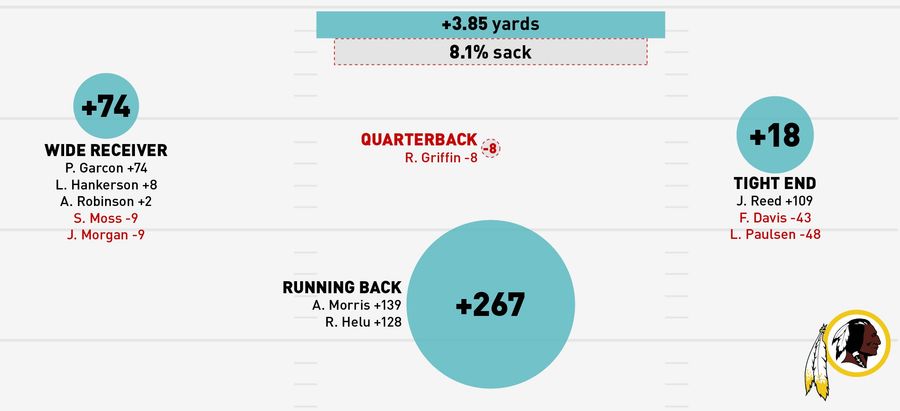
19. Washington Redskins: -3.0% DVOA (Prev. 15)
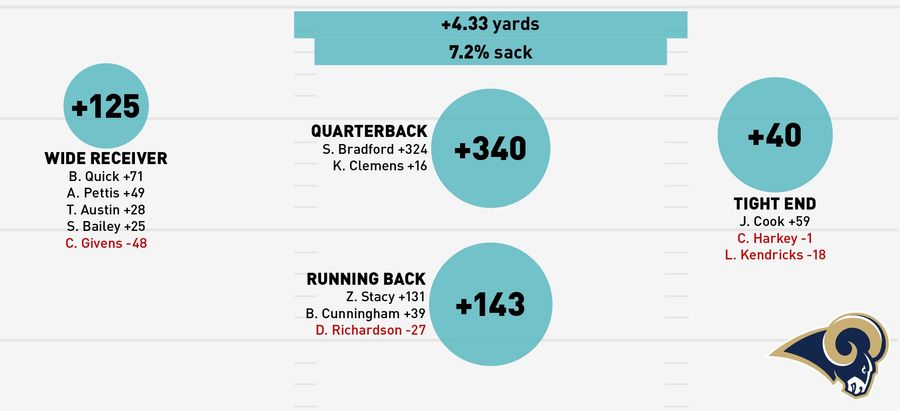
20. St. Louis Rams: -4.3% DVOA (Prev. 24)
21. Cincinnati Bengals: -5.1% DVOA (Prev. 11)
22. Tampa Bay Buccaneers: -6.6% DVOA (Prev. 30)
23. Minnesota Vikings: -7.1% DVOA (Prev. 22)
24. Arizona Cardinals: -7.2% DVOA (Prev. 26)
25. Buffalo Bills: -8.2% DVOA (Prev. 21)
26. Houston Texans: -12.3% DVOA (Prev. 29)
27. New York Giants: -12.9% DVOA (Prev. 27)
28. Cleveland Browns: -17.7% DVOA (Prev. 23)
29. Oakland Raiders: -18.4% DVOA (Prev. 28)
30. Baltimore Ravens: -20.7% DVOA (Prev. 25)
31. New York Jets: -27.2% DVOA (Prev. 31)
32. Jacksonville Jaguars: -36.1% DVOA (Prev. 32)
Top image by Jim Cooke
Related
Can MMA Fix Its Officiating Problem After UFC Baku?
USMNT's World Cup Path Gets Tougher After Group Stage Draw


Dancing Mr. Met Perfectly Captured the Mets' 2026 Collapse

Wimbledon 2026 Predictions: Best Bets for the Men's Draw
UFC Baku Picks: Three Bets to Target on Saturday's Main Card

NBA Free Agency Just Got Much Tougher After the Draft
- College Football Championship Odds: Four Value Bets for 2026
- Paul Skenes Headlines Friday June 26th's Best MLB Bets
- Three MLB Bets Worth Targeting on Thursday June 25 Slate
- MLB Picks Today: Backing the Yankees and Phillies-Nationals Over
- Tuesday MLB Best Bets: Two Pitching Props Worth Playing
- Prediction Markets Reveal Interesting NBA Draft Longshots
- UFC Vegas 119 Predictions: Best Bets for Kape vs. Horiguchi Fight Night
