
MLB Had The Highest Rated All-Star Game In Sports This Year

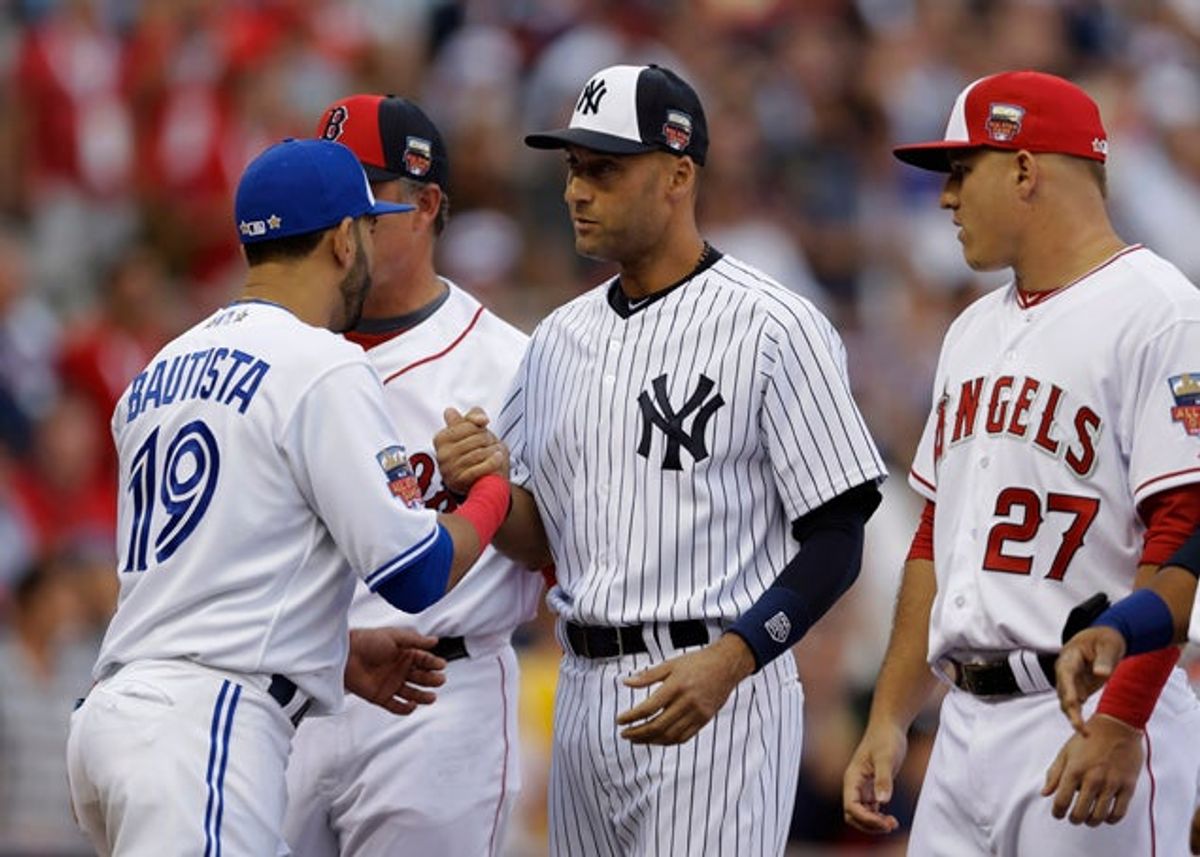
This year's MLB All-Star Game was the most watched since 2010 making it the highest rated All-Star event among pro sports this year, according to Forbes. This seems remarkable—but it isn't just a one-year Jeter spike.
While the MLB ASG had a higher household rating than the Pro Bowl this year, the Pro Bowl has fared slightly better in recent years. We took a look over the past few years, and both events bring in similar viewership, ranging from 10.9 million to 13.4 million viewers since 2010. These numbers dwarf the NBA All-Star Game, which has seen viewership range from 6.8 million to 9.1 million since 2010. Meanwhile, the dipshit NHL has played just two All-Star games since 2010. It got 1.3 million to 1.5 million viewers in 2011 and 2012, but those years were sandwiched between lockouts and the Olympics. The hockey All-Star game will be back next year, we think.
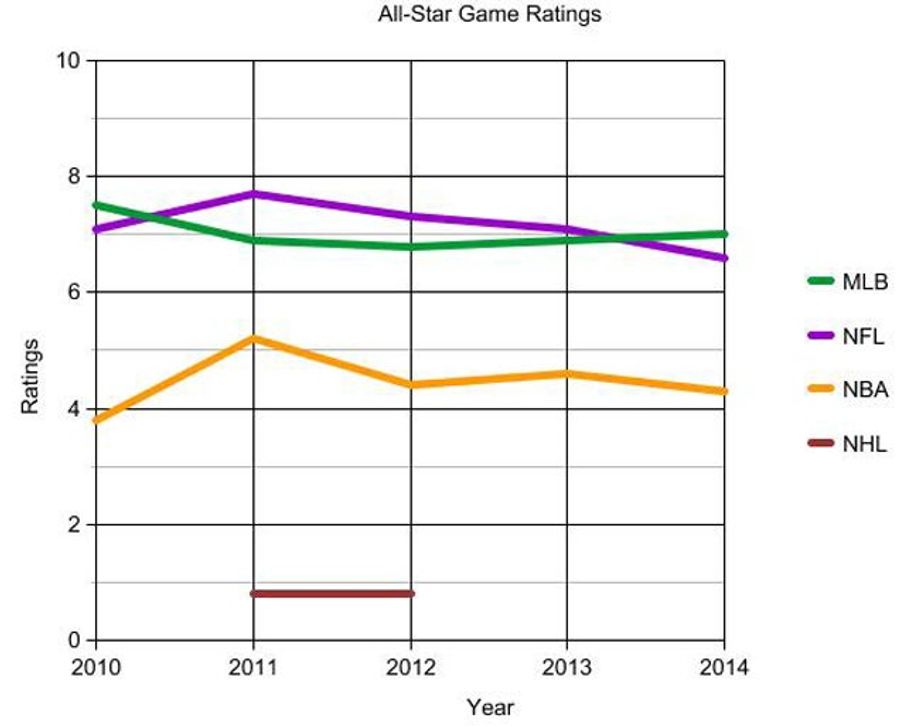
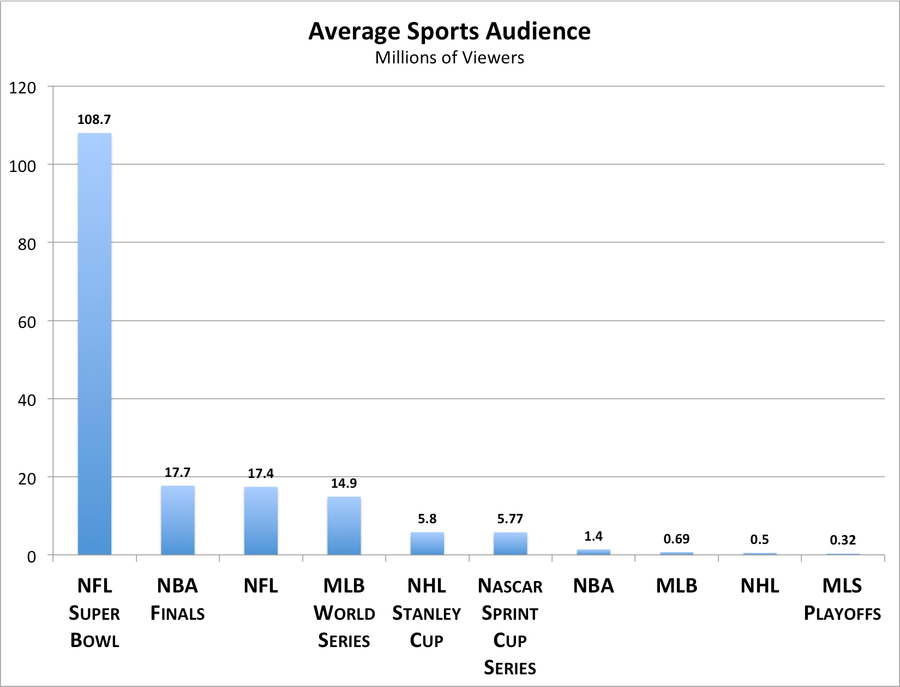
These numbers only look at the All-Star games themselves. The NBA also hosts All-Star Saturday Night, which brings in additional viewers. Dunk and three-point contests attract viewers that might not watch the All-Star Game. Similarly, the home run derby holds its own on cable programming, and the NHL's Skills Competition is likewise excluded. The NFL doesn't really have an equivalent of these events. Above are a graph and table showing household ratings and viewers for each of the league's All-Star games since 2010. Below, you can see how they stack up in a bar graph form from earlier this year, which shows the viewership for non-all-star events, wherein the NFL regular season outpaces MLB's World Series.
Even though we don't have time-slot-specific numbers for these (we reached out to Nielsen and haven't heard back), baseball somehow finding itself out in front makes some sense given that baseball has the most games, and also its all-star game most resembles an actual game.
[ Forbes]
| Year | League | Rating | Viewers |
|---|---|---|---|
| 2010 | MLB | 7.5 | 12,100,000 |
| 2010 | NFL | 7.1 | 12,297,000 |
| 2010 | NBA | 3.8 | 6,846,000 |
| 2011 | MLB | 6.9 | 11,000,000 |
| 2011 | NFL | 7.7 | 13,406,000 |
| 2011 | NBA | 5.2 | 9,093,000 |
| 2011 | NHL | 0.8 | 1,481,000 |
| 2012 | MLB | 6.8 | 10,900,000 |
| 2012 | NFL | 7.3 | 12,498,000 |
| 2012 | NBA | 4.4 | 7,070,000 |
| 2012 | NHL | 0.8 | 1,317,000 |
| 2013 | MLB | 6.9 | 11,000,000 |
| 2013 | NFL | 7.1 | 12,156,000 |
| 2013 | NBA | 4.6 | 8,000,000 |
| 2014 | MLB | 7 | 11,340,000 |
| 2014 | NFL | 6.6 | 11,378,000 |
| 2014 | NBA | 4.3 | 7,500,000 |
Tyreek Hill's Injury Update Has Prediction Markets Buzzing


Bengals Have No More Excuses Entering the 2026 NFL Season

MLB Player Props Today: Best Bets for Wednesday, July 22


Why the WNBA Won't Monetize Sophie Cunningham's Viral Point

- MLB Best Bets: Jacob Misiorowski, Dylan Cease Lead Monday's Top Picks
- Athletics vs. Diamondbacks Predictions: Best Bets, Odds and Props for Monday
- UFC Fight Night Best Betting Picks for Du Plessis vs. Usman in OKC
- France vs. England Best Bets: Three Picks for the World Cup Third-Place Match
- Dodgers vs. Yankees Friday July 17 Best Betting Picks and Props
- July 17 White Sox vs. Blue Jays Prediction, Odds and Best Bets
- Three MLB Futures Bets to Make After the All-Star Break
