
Which Hockey Leagues Have The Most Fights?

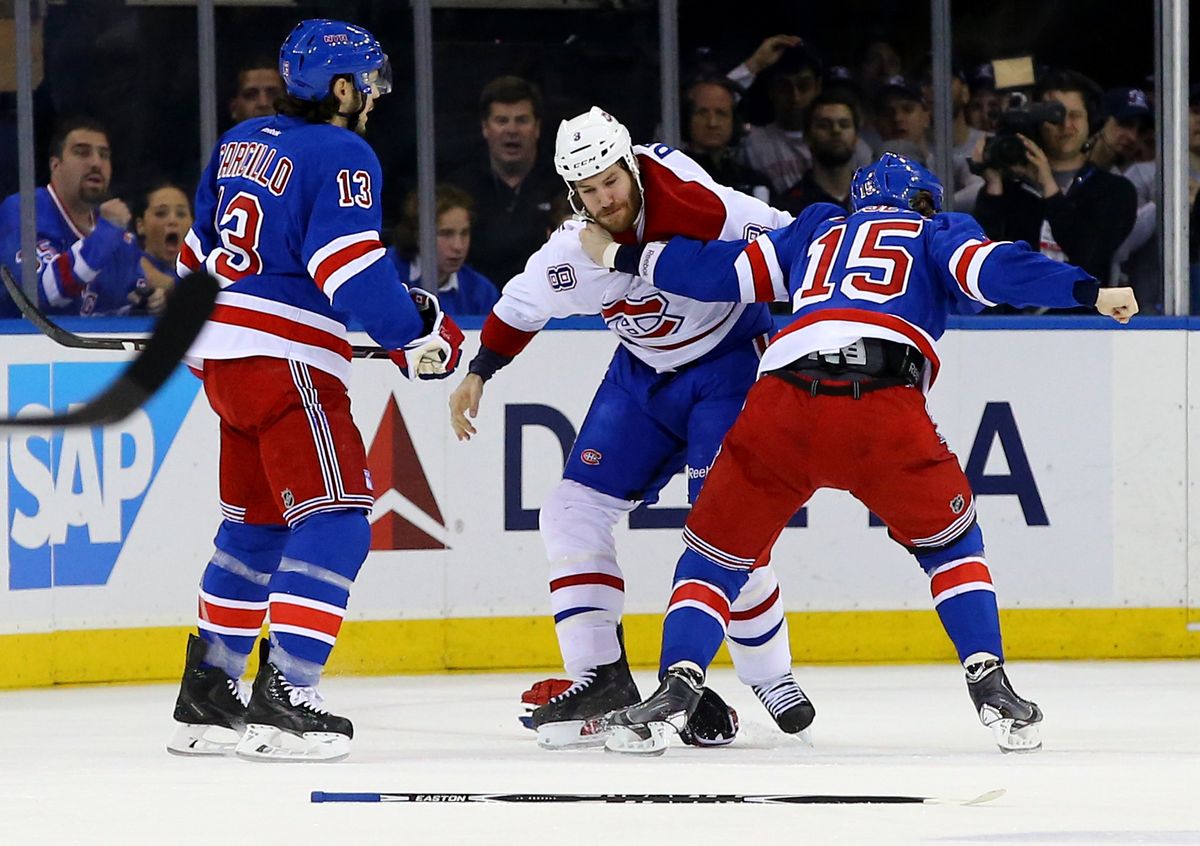
The NHL has a lot more fights than, say, the NFL, but how does it stack up against other levels of hockey competition? To find out, Simon Garnier of Graph Zoo pulled data from the (hilariously '90s) site dropyourgloves.com and put together a neat graphic on "fights per game" across almost 100 active and inactive leagues worldwide.
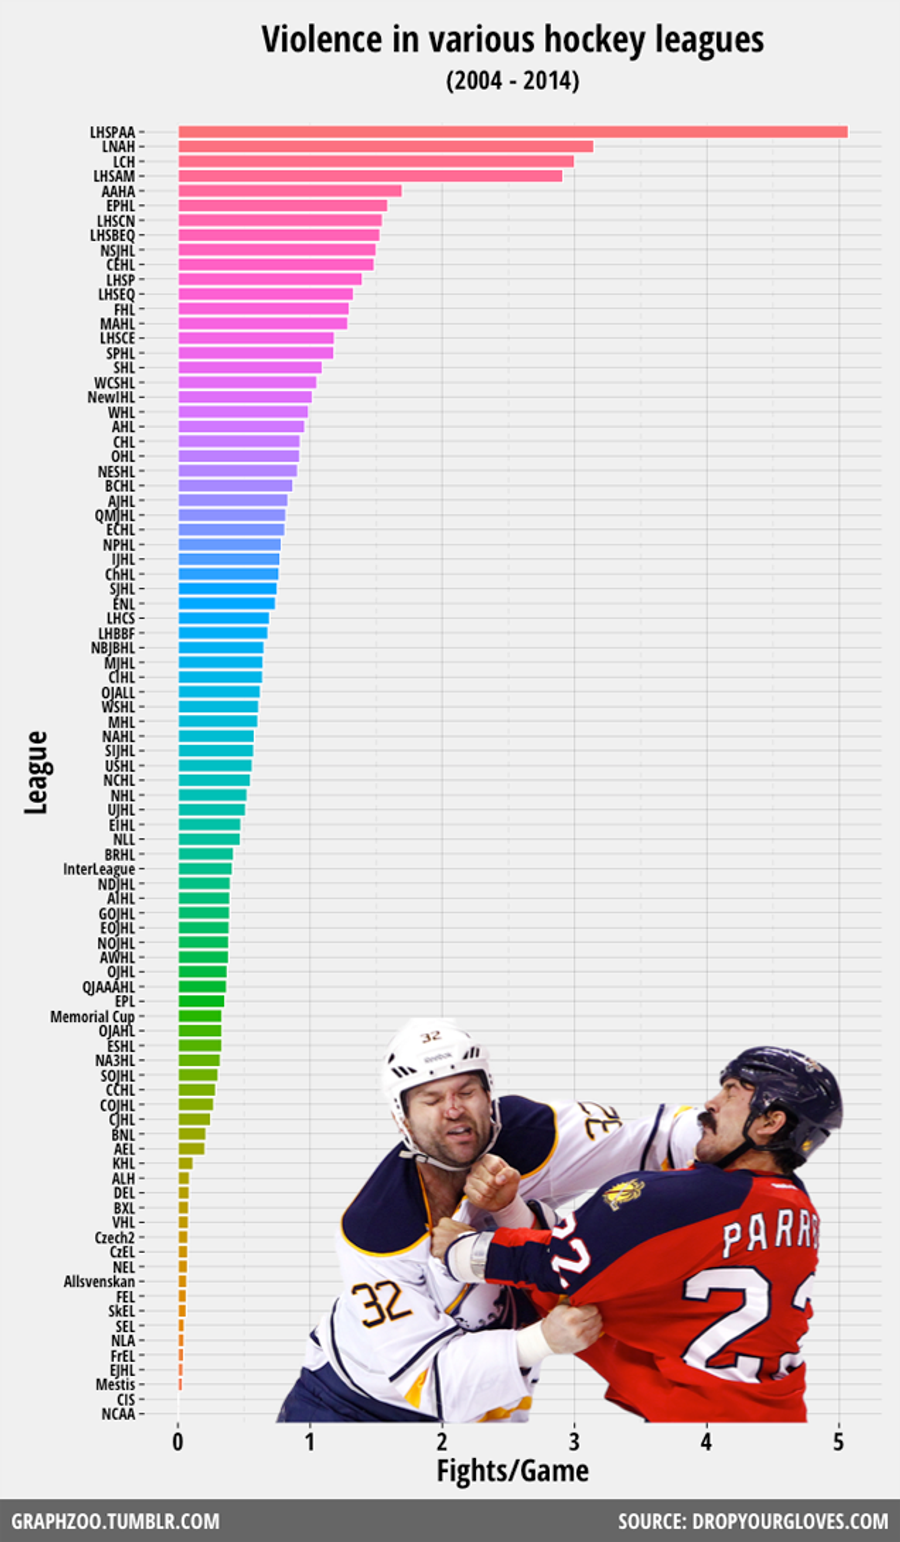
The full chart is below. The NHL falls in the middle—just to the right of the first "e" in "League"—but the real story here is the LHSPAA, a Quebec Senior AA Hockey League, which posts over five fights per game.
An example of an LHSPAA fight:
The LHSPAA folded in 2006. According to a poster on the hockeyfights.com messageboard, to which we defer on all things hockey and fistic, it acted as a sort of brawling farm system for the famously brutal LNAH. That Quebecois league, along with two of its other feeders (LCH and LHSAM), managed around three fights per game, which either says something about how these numbers were collected, or says something about how hockey is played in Quebec. NCAA hockey—where fighting is treated like fighting in other sports is treated—has zero fights per game, as does CIS, Canada's collegiate league.
Garnier was also kind enough to provide his full data and code, if you want to dig around a bit more.
Related


What Prediction Markets Are Telling Us About NFL 2026 MVP

The Sacramento Kings Need to Blow It Up Before It's Too Late


Ben Askren Didn't Win the Match—But He Won the Weekend
- UFC Fight Night Best Betting Picks for Du Plessis vs. Usman in OKC
- France vs. England Best Bets: Three Picks for the World Cup Third-Place Match
- Dodgers vs. Yankees Friday July 17 Best Betting Picks and Props
- July 17 White Sox vs. Blue Jays Prediction, Odds and Best Bets
- Three MLB Futures Bets to Make After the All-Star Break
- Three Heisman Trophy Sleepers Worth Betting Before the 2026 Season
- England vs. Argentina Best Bets: Three Picks for the World Cup Semifinal
