
Heat Map: Did The Final Four Pay Off For Atlanta?

Do stadiums really generate revenue for cities? It's a complicated question, but the short answer is: 1) Yeah, some, but 2) Not nearly enough to offset the enormous public costs of these developments.
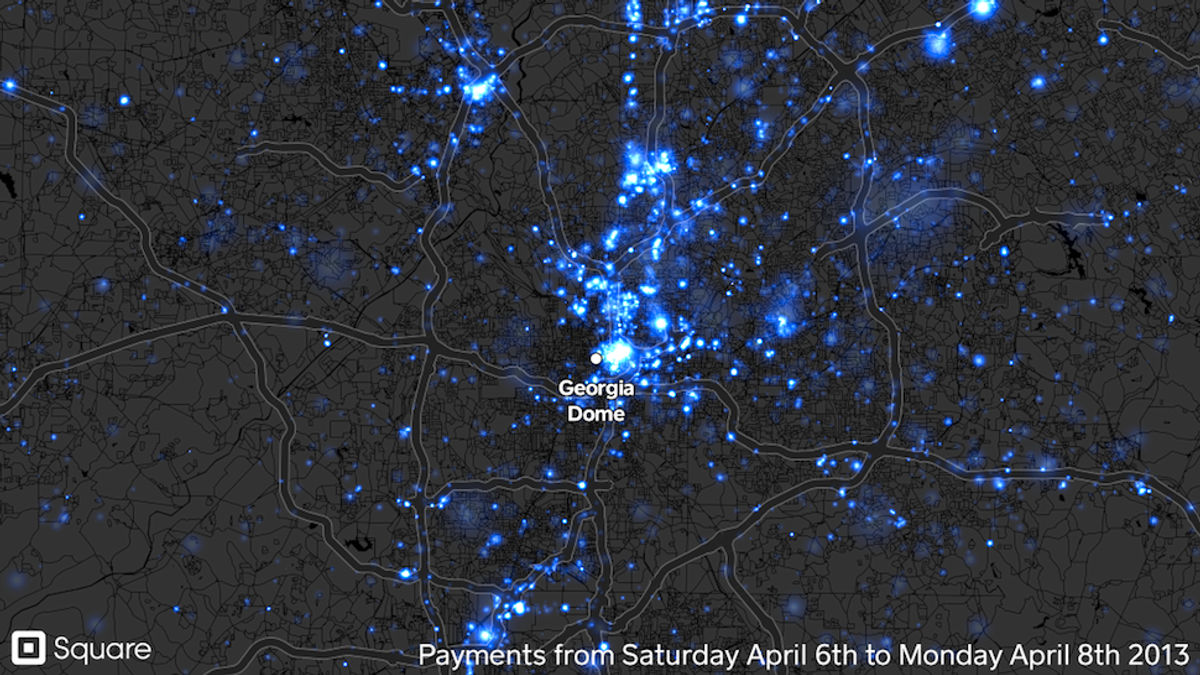
The most commonly cited revenue stream from stadiums is the retail sales–and resulting sales taxes–that they bring in, particularly from major events. This sales data can be frustrating to track down, but Square, the company that makes the card readers you've probably seen around, was awesome enough to generate a heat map of transactions made using their devices during the Final Four in Atlanta. To draw any real conclusions, you have to compare it to the previous week:
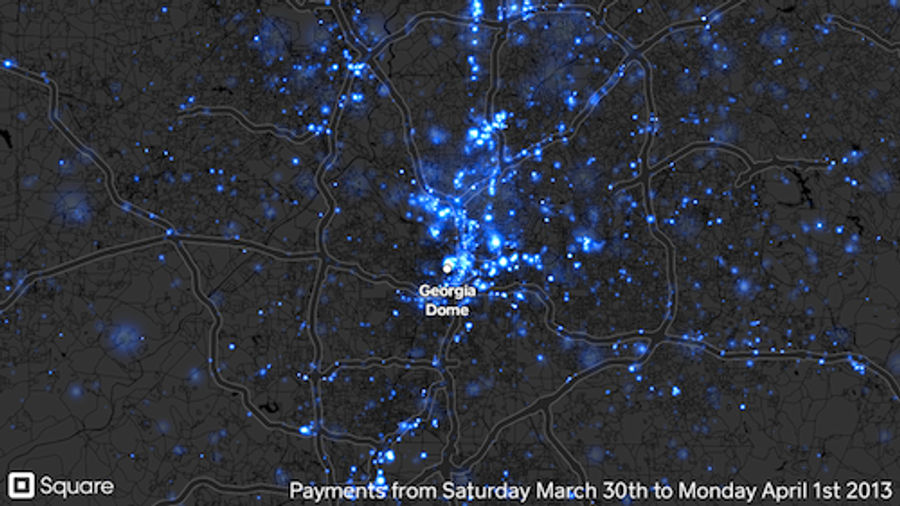
Square reports that this is a week-to-week 11 percent increase in total sales, from $1.6 million to $1.8 million. This is more than double the $800,000 in sales that Square reported for their similar Super Bowl map, which makes sense given that that bigger event took place in a much smaller metropolitan area.
An 11 percent jump is nothing to laugh at, but only a portion of that money will make it back to the city and state through sales taxes and, eventually, property/income taxes. The Georgia Dome cost $214 million in 1992. That's $345 million in 2012 dollars. It was 100 percent publicly funded.
I've annotated the map at the top with some of the spots that appear to have seen the biggest sales jump during the Final Four, help me out and add your own!
Update: Here's a much easier way to compare those two maps.

What Prediction Markets Are Telling Us About NFL 2026 MVP
The Sacramento Kings Need to Blow It Up Before It's Too Late


Ben Askren Didn't Win the Match—But He Won the Weekend
- UFC Fight Night Best Betting Picks for Du Plessis vs. Usman in OKC
- France vs. England Best Bets: Three Picks for the World Cup Third-Place Match
- Dodgers vs. Yankees Friday July 17 Best Betting Picks and Props
- July 17 White Sox vs. Blue Jays Prediction, Odds and Best Bets
- Three MLB Futures Bets to Make After the All-Star Break
- Three Heisman Trophy Sleepers Worth Betting Before the 2026 Season
- England vs. Argentina Best Bets: Three Picks for the World Cup Semifinal
