How The Crazy-Ass AL Division Races Unfolded: Visualizing Momentum

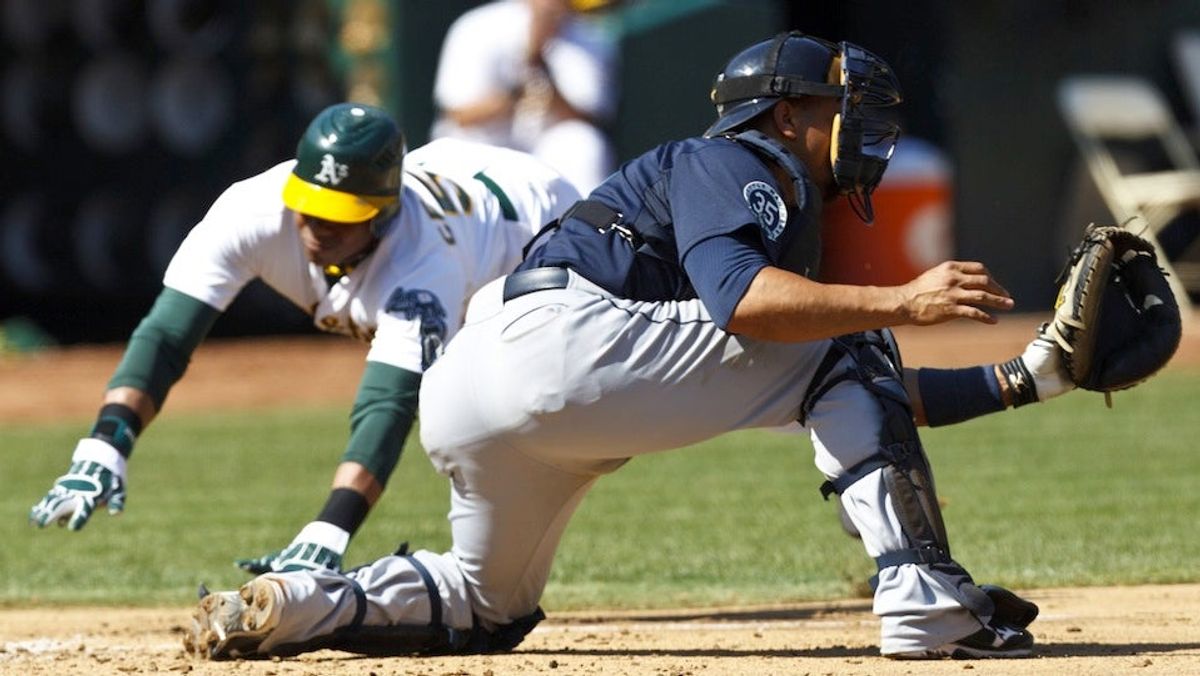
The Athletics and the Yankees clinched their respective division titles on the same day, but the paths they took to get there were very different. The A's budget freight train slammed through a Rangers squad that had sat atop the AL West for over 170 consecutive days, while the Yankees barely edged the Orioles despite having opened up a double-digit lead on them months earlier.
Momentum is an overplayed concept in sports, as a team's most recent couple games aren't as informative as its performance over an entire season. It's also a classic example of the " hot-hand fallacy" of sports statistics: individual games should usually be treated as independent events. However, the Athletics' season shows that a team can still play at different skill levels over a long period of time: They won 48 percent of their first 81 games and 68 percent of the last 81.
I wanted to create a stat that explained a team's strength at a given point in the season. It had to be more robust than streaks or records in the last 10 games, but simple enough that I could calculate it before people stopped caring about baseball. Here is my attempt at measuring a team's momentum over time; let's call it the Mo Score. A team's Mo Score after a game is equal to 95 percent of its score heading into the game, plus or minus one depending on whether it won or lost. By the end of the season, every game is part of the total, but the first game is worth about 4,000 times less than the 162nd.
Here are charts for all three of the AL division races. The lines represent a five-day moving average of Mo Score (in order to smooth out the curves). Think of them as a mood index, or the length of a rope on the team's side in a tug-of-war with .500.
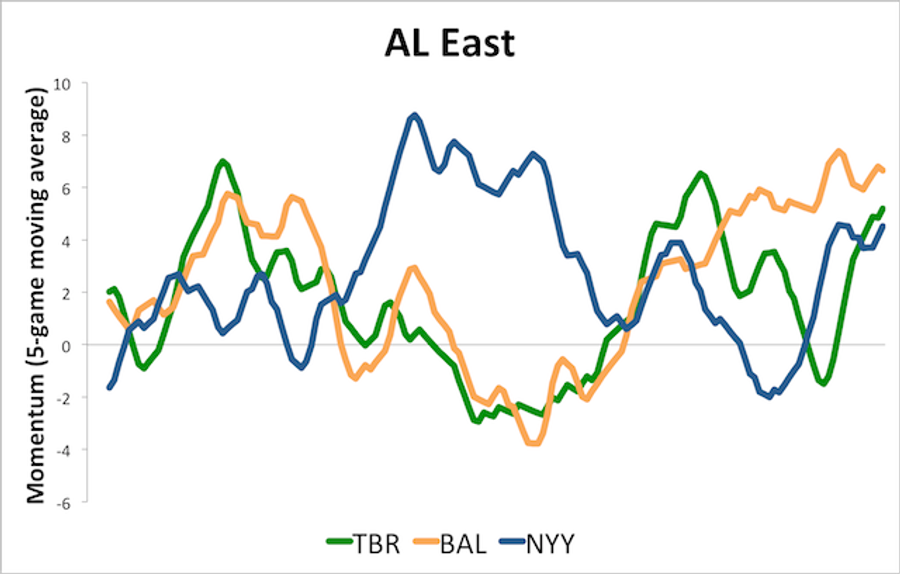
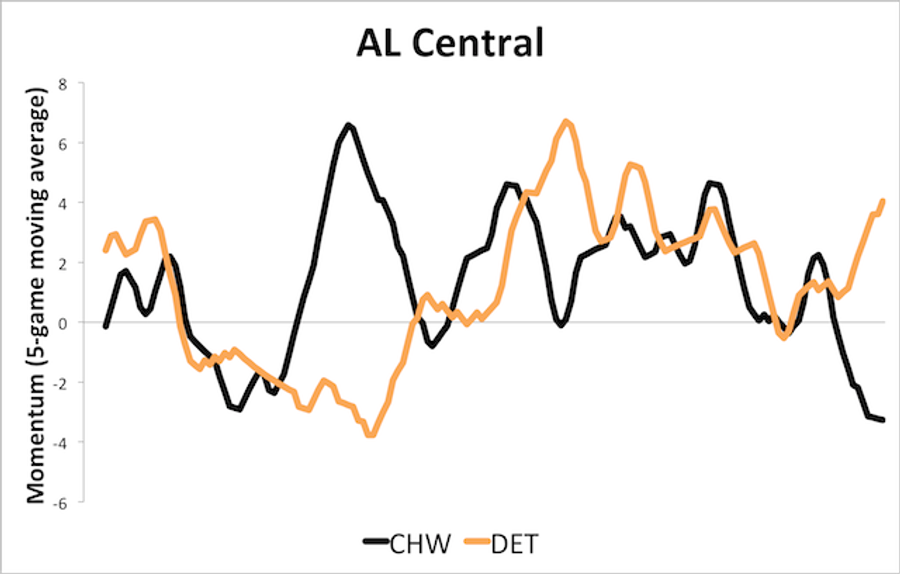
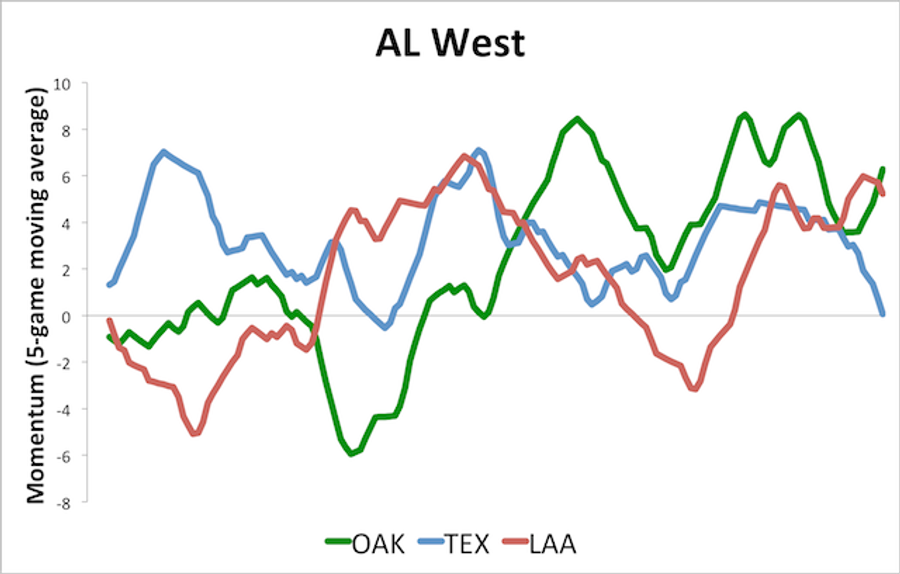
The Rangers spent almost the entire season heading in the right direction, but that wasn't enough to stop the A's, who made up for their early slide with a pair of surges in the second half. In the East, the Yankees needed every inch of the ground they'd gained in the middle third of the season to hold off Baltimore. The Central was a more consistent version of the West, as Chicago's late slide allowed Detroit to take the division.
This is just one way of looking at standings over time: BaseballRace.com provides historical data and a cool interactive graph that shows each team racing against its rivals, and Baseball Prospectus's playoff odds page has customizable graphs that show how each team's chances rose and fell over time. Those methods focus on the position of the teams, while I'm more concerned with their velocity. However, you can reverse-engineer the positions from my charts. If you take the area between the horizontal axis and the curve below it, and subtract that from the area between the curve and axis on the top half, the result would be roughly proportional to the number of games that a team finished over .500. It's kludgy calculus. Perhaps a stat like this could replace the streak and last-10 columns in the standings. If you have any ideas for improving it or have seen anything similar, let me know in the discussion.
Related

Why Tyrese Maxey Is the Key to the Sixers’ Success

Seahawks vs. Chiefs Betting Pick: SNF Best Bets




Why Did Netflix Mike Tyson Docuseries Omit His Last Fight?




Ohio State’s Season Is in Jeopardy After Julian Sayin Injury
- UFC 333 Betting Lines Are Tightening Across a Wide-Open Fight Card
- UFC 333 Betting Splits: Where the Sharp Money Is Landing This Weekend
- NBA Best Bets Today: Pacers, Grizzlies and Trail Blazers Picks
- College Football Week 8 Best Betting Picks, Predictions
- World Series Game 1 Predictions: Rays vs. Brewers Picks and Best Bets
- UFC 333 Predictions: Best Bets for Volkov, Keita and Murzakanov
- UFC 333 Underdog Pick: Why Dominick Reyes Is Worth a Bet