
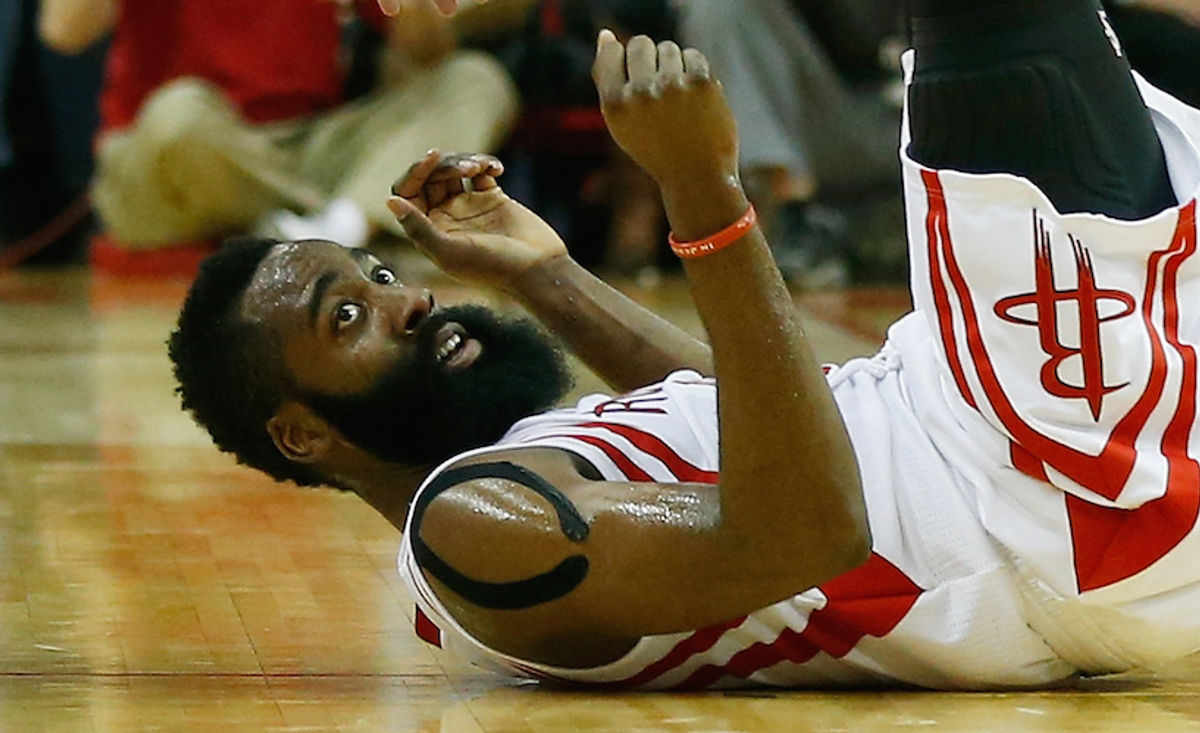
Chart Of James Harden's Defense Looks Just As Bad As You'd Expect

This year's Sloan papers are making their way around this week, and like last year Kirk Goldsberry has a preview of the Harvard entrant on Grantland. This year's is about observing and measuring defense using the NBA's player-movement-tracking system, SportVU.
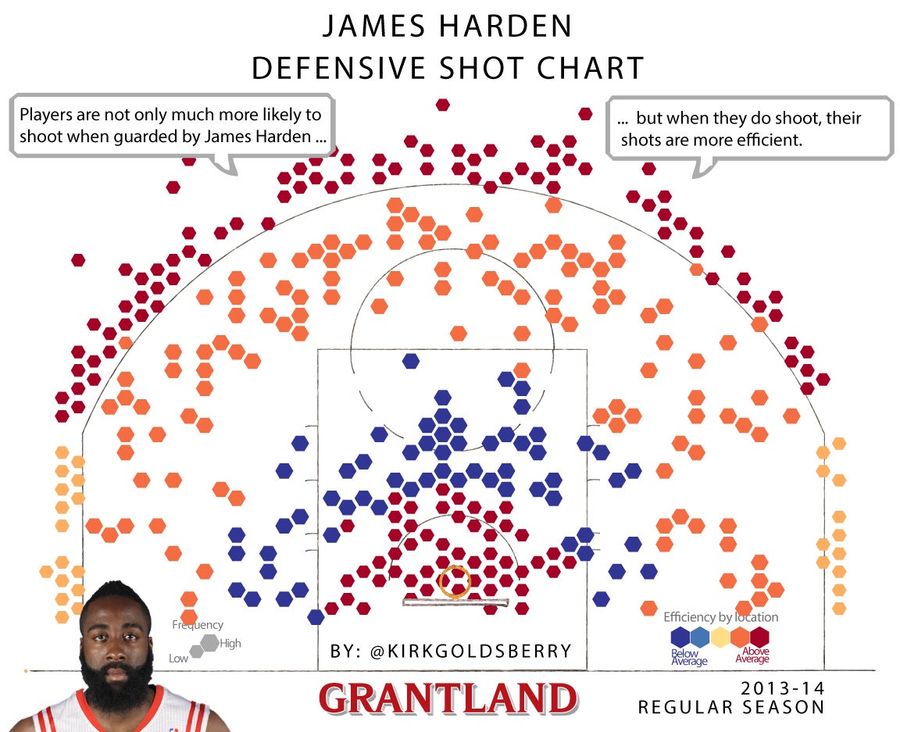
The short version is that Alexander Franks and Andrew Miller are taking SportVU data and using the players' average location as a play progresses to determine who is guarding whom, and then determining how often a defender's man shoots, and how effective he is when he does. The full paper is online here, and there are a bunch of charts for star players in the Grantland post, like the one for James Harden's 2013-14 season here:
An accurate, digestible audit of defense is one of the big hopes pinned to SportVU player tracking. Last year's EPVA paper from Harvard was cool because it showed how a possession's theoretical value can change from moment to moment pending a near-infinite progression of decisions, but within basketball analysis any new offensive stat is the rich getting richer. If you looked at the EPVA methods a little sideways, though, you could see how those might be reverse engineered into spitting out something useful about defense. That's what's going on here, and within the relatively barren economy of NBA defensive stats, it's very cool.
That said, it's likely to suffer from a lot of the same problems as other player-charting stats, like Synergy's stats about how individual players fare against pick-amd-rolls or iso plays: basically, you can't know what a player was supposed to be doing, or how much help he was supposed to have.
The Harden graphic above is basically a smell test. You don't need a defensive shot chart to know that Harden often sets picks on his own teammates on defense and would probably turn an ankle if you asked him to stand in front of a mailbox; nor do you need one to know that Kawhi Leonard is a much better defender than Harden, and gives up much less efficient shots. But the known quantities play out true enough to how we observe them that, if something like this stat ever becomes widely available ( which it won't), it would be viable as a quick reference for how other, lesser known players are faring defensively. Alternatively, the chart is plenty useful all on its own for showing to anyone trying to cite chapter-and-verse of defensive rating or whatever permutation of plus-minus we're on this week to argue that James Harden is not shit at defense now.
[ Grantland]
Related

What Prediction Markets Are Telling Us About NFL 2026 MVP
The Sacramento Kings Need to Blow It Up Before It's Too Late


Ben Askren Didn't Win the Match—But He Won the Weekend
- UFC Fight Night Best Betting Picks for Du Plessis vs. Usman in OKC
- France vs. England Best Bets: Three Picks for the World Cup Third-Place Match
- Dodgers vs. Yankees Friday July 17 Best Betting Picks and Props
- July 17 White Sox vs. Blue Jays Prediction, Odds and Best Bets
- Three MLB Futures Bets to Make After the All-Star Break
- Three Heisman Trophy Sleepers Worth Betting Before the 2026 Season
- England vs. Argentina Best Bets: Three Picks for the World Cup Semifinal
